



EURUSD downtrend is looking weak
The bearish cross in the pair may be short-lived: Chart
Share this:

The US Dollar was bearish against most of its major pairs on Monday with the exception of the NZD and JPY. On the US economic data front, no major economic data was released.
On Tuesday, the U.S. Trade deficit for August is expected to increase to 66.2 billion dollars on month, from 63.6 billion dollars in July. Finally, U.S. Job Openings for August are expected to release at 6.50 million jobs on month, compared to 6.62 million jobs in July.
The Euro was bullish against all of its major pairs. In Europe, research firm Markit has published final readings of September Services PMI for the Eurozone at 48.0 (vs 47.6 expected), for Germany at 50.6 (vs 49.1 expected), for France at 47.5 (as expected) and for the U.K. at 56.1 (vs 55.1 expected). The Eurozone's August retail sales rose +4.4% on month (vs +2.5% expected).The Australian dollar was mixed against all of its major pairs.
WTI Crude Oil jumped 2.3$ (+6.21%) to 39.35.
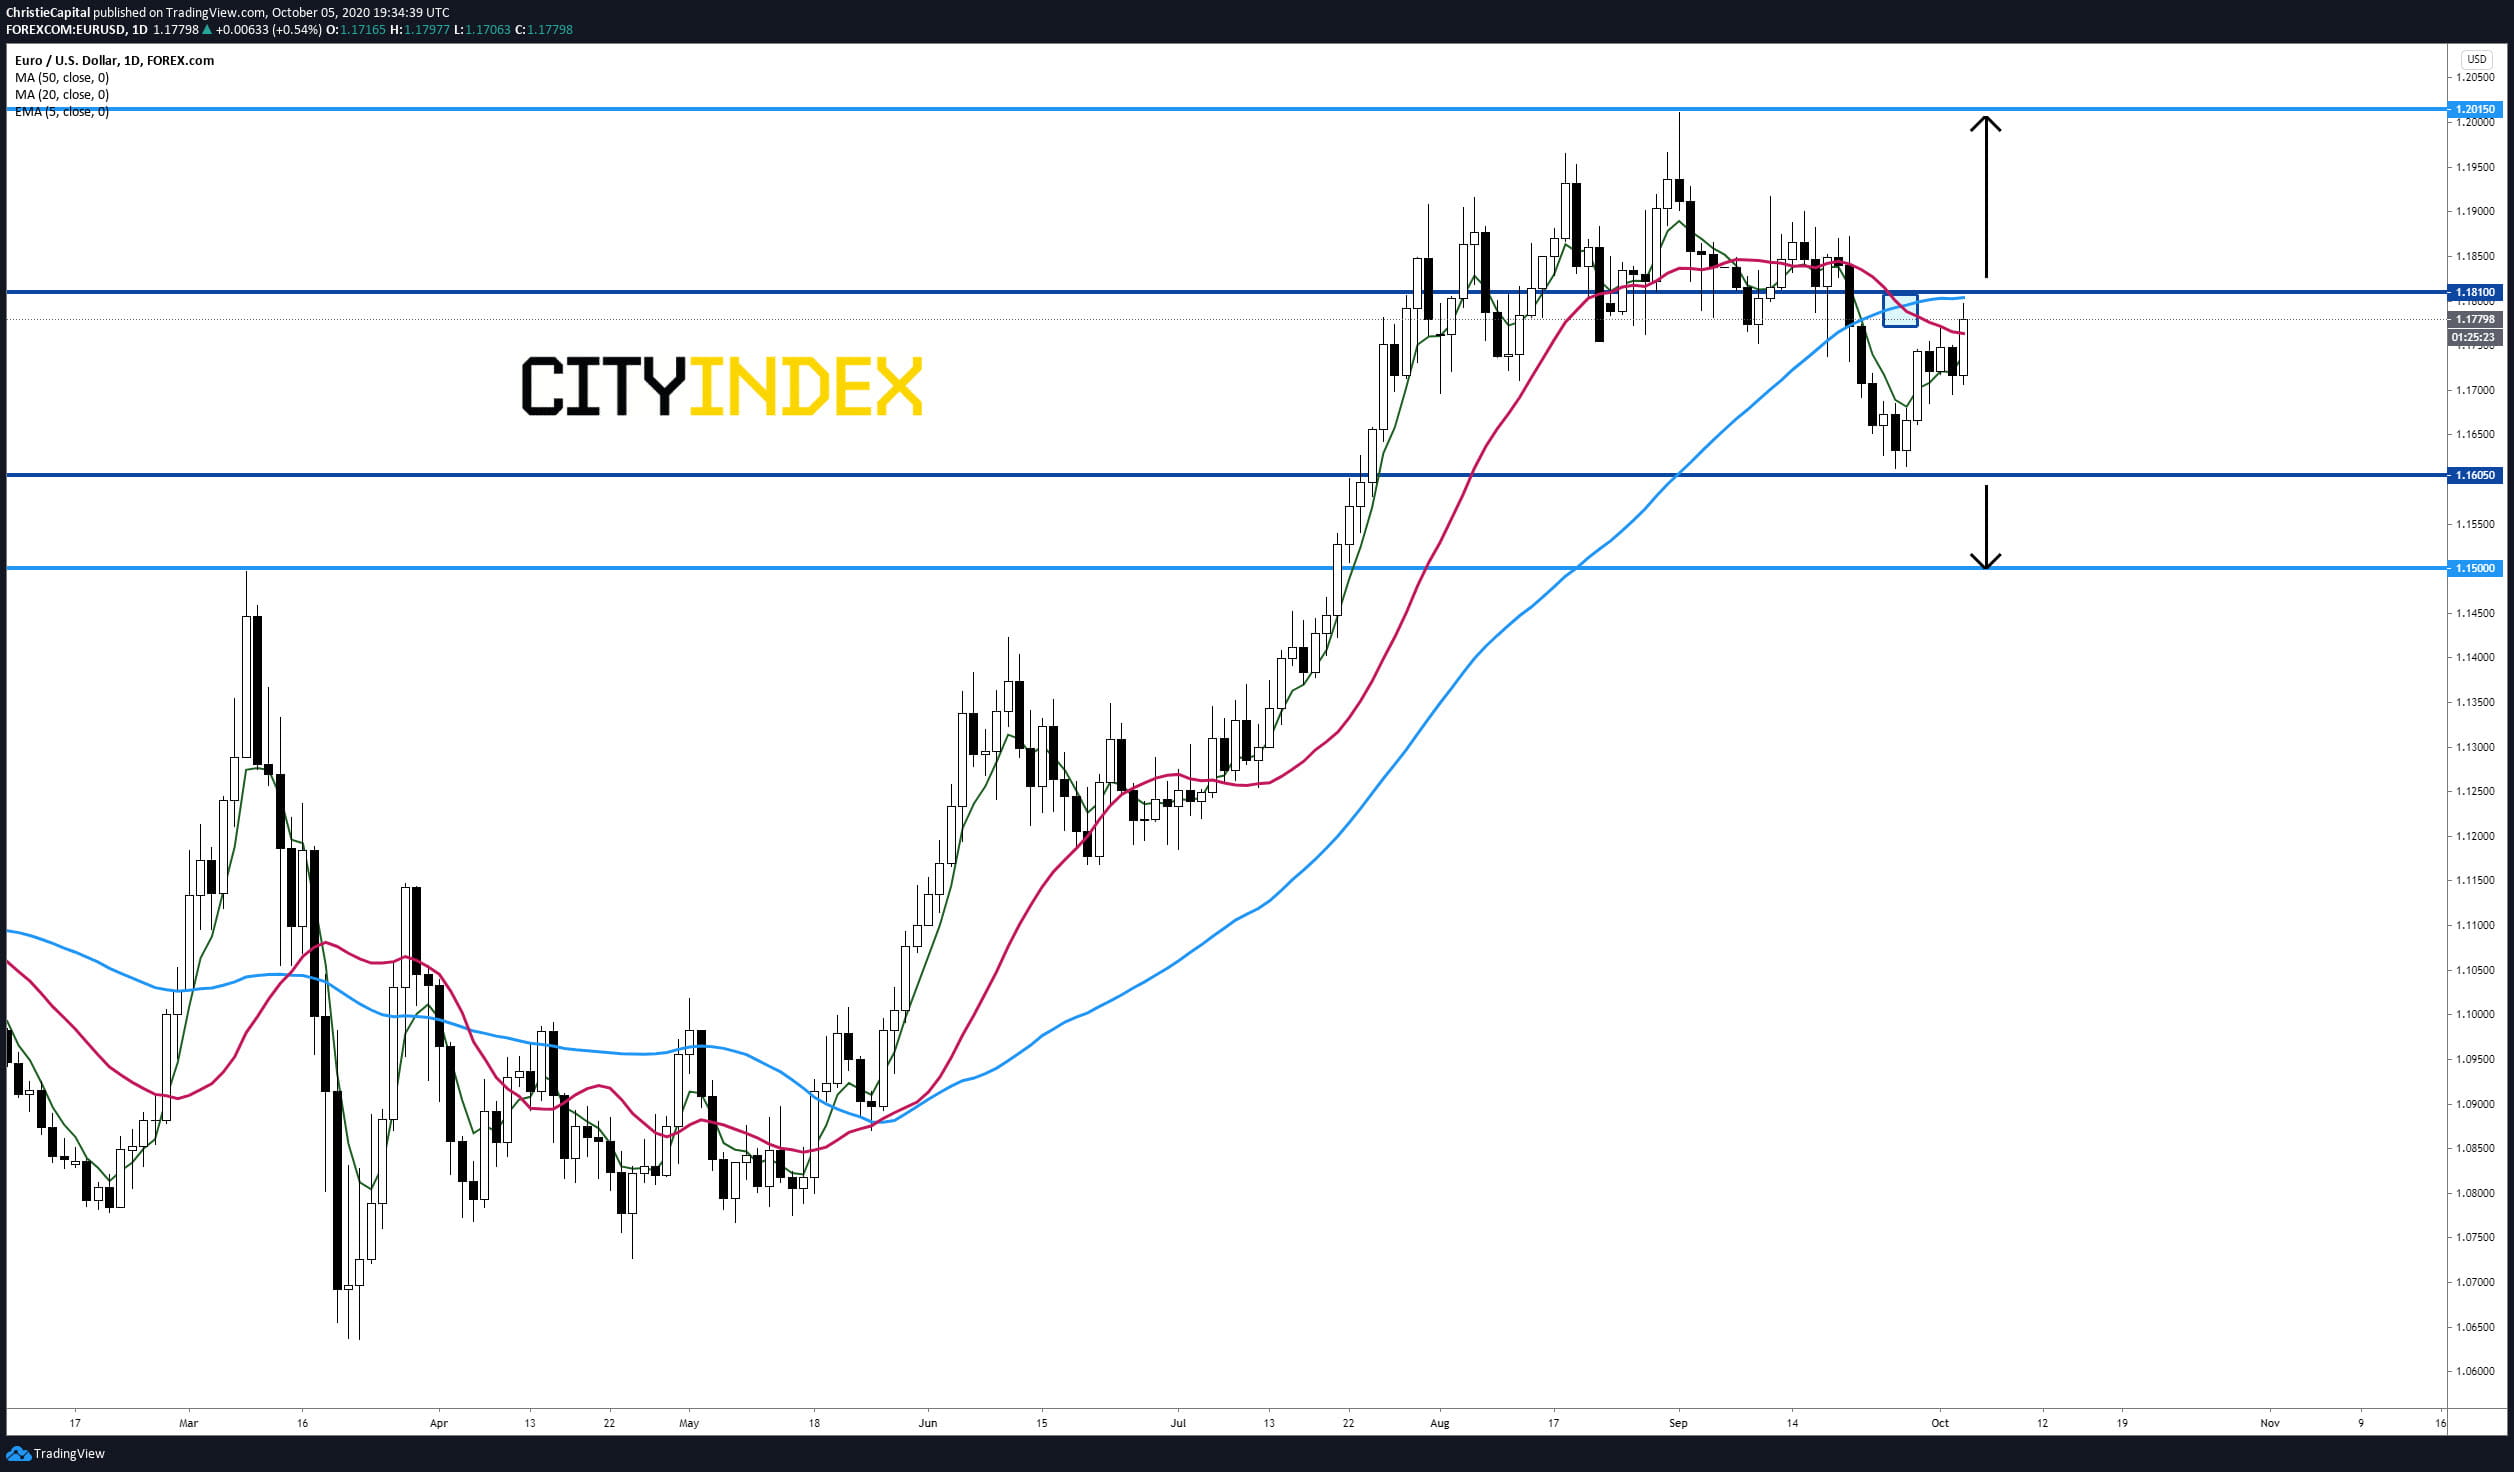
The largest gainer on the day was the EUR/USD which climbed 63 pips to 1.1779 in Monday's trading. A bearish cross remains in-play after the 20-day moving average crossed below the 50-day moving average however bearish momentum has failed to materialize. A break above the 50-day moving average near 1.181 would be a strong bullish signal. A break below 1.1605 support could cause an acceleration lower towards 1.15 key support that was acting as resistance back in March.
Source: GAIN Capital, TradingView
Happy Trading
The US Dollar was bearish against most of its major pairs on Monday with the exception of the NZD and JPY. On the US economic data front, no major economic data was released.
On Tuesday, the U.S. Trade deficit for August is expected to increase to 66.2 billion dollars on month, from 63.6 billion dollars in July. Finally, U.S. Job Openings for August are expected to release at 6.50 million jobs on month, compared to 6.62 million jobs in July.
The Euro was bullish against all of its major pairs. In Europe, research firm Markit has published final readings of September Services PMI for the Eurozone at 48.0 (vs 47.6 expected), for Germany at 50.6 (vs 49.1 expected), for France at 47.5 (as expected) and for the U.K. at 56.1 (vs 55.1 expected). The Eurozone's August retail sales rose +4.4% on month (vs +2.5% expected).The Australian dollar was mixed against all of its major pairs.
WTI Crude Oil jumped 2.3$ (+6.21%) to 39.35.
The largest gainer on the day was the EUR/USD which climbed 63 pips to 1.1779 in Monday's trading. A bearish cross remains in-play after the 20-day moving average crossed below the 50-day moving average however bearish momentum has failed to materialize. A break above the 50-day moving average near 1.181 would be a strong bullish signal. A break below 1.1605 support could cause an acceleration lower towards 1.15 key support that was acting as resistance back in March.

Source: GAIN Capital, TradingView
Happy Trading

The complete CFD trading experience
Award-winning platforms, competitive spreads, low commissions and dedicated support.
We live and breathe the markets and are dedicated to helping traders realise their ambitions as we continue to set the industry bar.
Economic calendar
Web Trader platform
Our sophisticated web-based platform is packed with features.
Related articles

USD into a Massive Week as Yields Fly and Gold Breaks
It’s a huge week with PCE and NFP, but it’s what’s happening off of the calendar that demands attention with US yields flying to fresh multi-decade highs.


USDJPY Forecast Intervention Fears Clash with Dollar Strength
Recent trading sessions have produced mixed results for the Japanese yen. By the end of last week, USD/JPY had fallen by more than 1.00%, reflecting a modest recovery in the yen. However, the start of this week has seen the pair move slightly back in favor of the U.S. dollar, posting gains of around 0.04%.


AUD/USD forecast: Currency Pair of the Week | September 28, 2026
The week has started with stocks, gold, silver and bitcoin all falling, as crude oil rebounded and bond yields pushed further higher. Trump refusing to agree to Tehran’s proposal to re-open the Strait of Hormuz has left the markets disappointed. Still, reports that mediators are expected to hold talks with the two sides on an amended version of the 7-day proposal that Iran presented, keeps hopes alive that we may see some progress.
StoneX Europe Ltd may make third party material available on this website which may contain information included but not limited to the conditions of financial markets. The material is for information purposes only and does not contain, and should not be construed as containing, investment advice and/or investment recommendation and/or an investment research and/or an offer of or solicitation for any transactions in financial instruments; any decision to enter into a specific transaction shall be made by the client following an assessment by him/her of their situation.
StoneX Europe Ltd makes no representation or warranty and assumes no liability as to the accuracy or completeness of the information provided, nor any loss arising from any investment based on a recommendation, forecast or other information supplied. You should always seek independent advice as to your suitability to speculate in any related markets and your ability to assume the associated risks, if you are at all unsure. We are not under any obligation to update any such material. Any opinion made may be personal to the author and may not reflect the opinion of StoneX Europe Ltd.