



ExxonMobil Risk Breaking Below March Low
Pressure has been mounting on ExxonMobil's share price, as its technical outlook points to a potential new down leg...
Share this:

Pressure has been mounting on ExxonMobil's share price, after the U.S. oil giant posted historical quarterly losses in late July. Furthermore, the company warned that low energy prices could wipe 20% of oil and natural gas reserves off its books. To make thing worse, ExxonMobil was kicked out the Dow Jones Industrial Average in late August.
Meanwhile, the relationship between ExxonMobil's management and its shareholders appears to be uncertain, as major shareholder BlackRock said previously it voted against the company's board of directors for failing to make progress on tackling the climate crisis and "effective corporate governance is lacking".
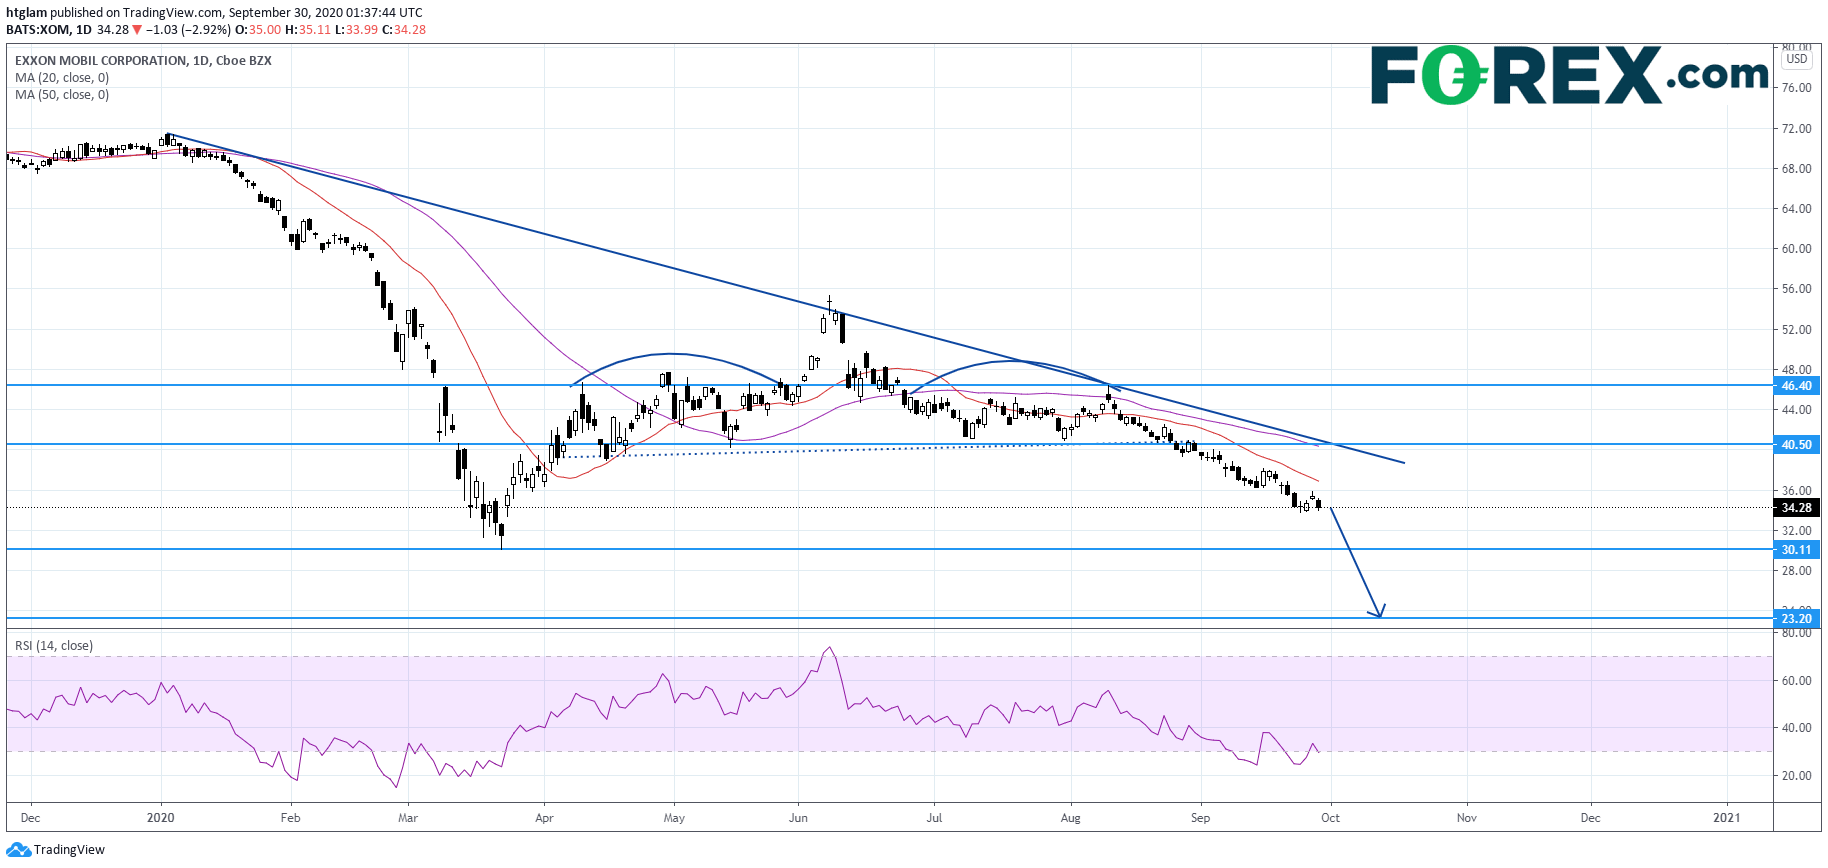
On a daily chart, ExxonMobil (XOM) is capped by a long-term bearish trend line drawn from January. In fact, it has formed a head and shoulders pattern, with the neckline broken. The level at $40.50 might be considered as the nearest resistance, while the 1st and 2nd support are expected to be located at $30.11 and $23.20 respectively. Alternatively, a break above $40.50 would suggest that the next resistance at $46.40 may be challenged.

Source: Gain Capital, TradingView
Pressure has been mounting on ExxonMobil's share price, after the U.S. oil giant posted historical quarterly losses in late July. Furthermore, the company warned that low energy prices could wipe 20% of oil and natural gas reserves off its books. To make thing worse, ExxonMobil was kicked out the Dow Jones Industrial Average in late August.
Meanwhile, the relationship between ExxonMobil's management and its shareholders appears to be uncertain, as major shareholder BlackRock said previously it voted against the company's board of directors for failing to make progress on tackling the climate crisis and "effective corporate governance is lacking".
On a daily chart, ExxonMobil (XOM) is capped by a long-term bearish trend line drawn from January. In fact, it has formed a head and shoulders pattern, with the neckline broken. The level at $40.50 might be considered as the nearest resistance, while the 1st and 2nd support are expected to be located at $30.11 and $23.20 respectively. Alternatively, a break above $40.50 would suggest that the next resistance at $46.40 may be challenged.
Source: Gain Capital, TradingView
Latest market news




The complete CFD trading experience
Award-winning platforms, competitive spreads, low commissions and dedicated support.
We live and breathe the markets and are dedicated to helping traders realise their ambitions as we continue to set the industry bar.
Economic calendar
Web Trader platform
Our sophisticated web-based platform is packed with features.
Related articles

Crude Oil Analysis: Geopolitical Risk Continues to Drive the WTI Barrel Higher
During recent trading sessions, a new wave of buying momentum has continued to gain relevance around WTI crude oil price action. Over the last three trading sessions, the market has maintained a bullish streak and is now up more than 5.5%, highlighting significant buying pressure in the short term.


Crude Oil Forecast WTI Prices Come Under Pressure as Middle East Risks Ease
Over the last two trading sessions, WTI crude oil has once again displayed a notable bearish bias, with prices falling nearly 6%. Part of this renewed selling pressure has been driven by recent developments in the Middle East, which have helped temporarily ease the geopolitical tensions that had supported the oil risk premium in previous weeks.

S&P 500, Nasdaq, Dow Forecast: Rising Yields Test Rally Ahead of Nvidia, Fed 8 22 2026
S&P 500, Nasdaq and Dow test key technical levels as momentum fades, raising the risk of a deeper correction heading into a pivotal week.

StoneX Europe Ltd may make third party material available on this website which may contain information included but not limited to the conditions of financial markets. The material is for information purposes only and does not contain, and should not be construed as containing, investment advice and/or investment recommendation and/or an investment research and/or an offer of or solicitation for any transactions in financial instruments; any decision to enter into a specific transaction shall be made by the client following an assessment by him/her of their situation.
StoneX Europe Ltd makes no representation or warranty and assumes no liability as to the accuracy or completeness of the information provided, nor any loss arising from any investment based on a recommendation, forecast or other information supplied. You should always seek independent advice as to your suitability to speculate in any related markets and your ability to assume the associated risks, if you are at all unsure. We are not under any obligation to update any such material. Any opinion made may be personal to the author and may not reflect the opinion of StoneX Europe Ltd.