


Gold outlook: XAU/USD hammered, stretched and vulnerable to a sharp rebound
Gold is getting hammered for solid fundamental reasons, but history suggests extreme four-hourly oversold conditions can produce violent countertrend rallies.
Share this:
- Gold’s 4.01% slump ranked 88th-largest since 1968
- US 10-year real yields hit highest since 2008
- Four-hourly gold indicators now show extreme oversold conditions
- $4,115 support in focus
Precious metals washout ranks among the largest on record
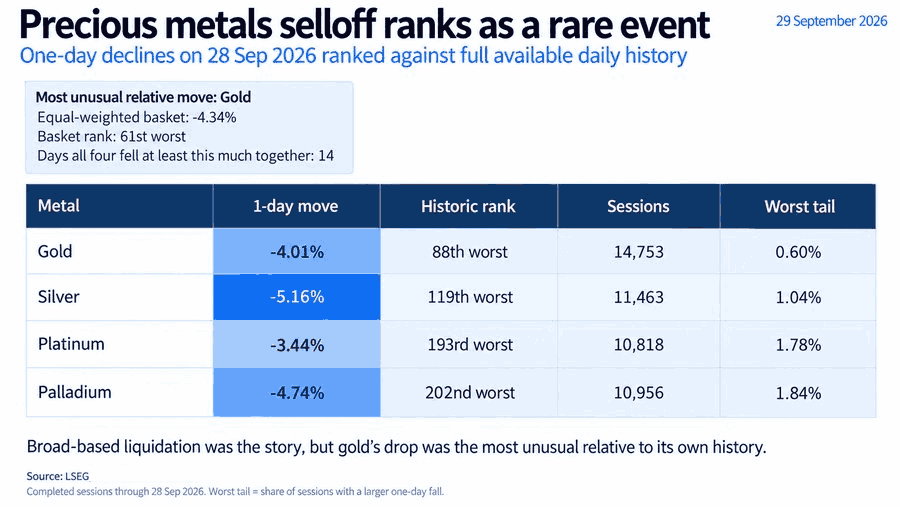
It was a brutal start to the week for gold and the broader precious metals complex, with massive losses seen that ranked right up there among the largest in history.
Gold slumped more than 4%, silver more than 5%, while platinum and palladium fell nearly 3.5% and 5% respectively. For gold, it was the 88th-largest daily decline in a dataset going back to 1968, with the moves in the other metals not far behind.
Source: LSEG
US real yields surge to levels not seen since 2008
As discussed in a separate analysis note released in early Asia on Monday, the current macro environment is extremely hostile for metals that offer no yield, have holding costs if held in physical form, and are predominantly priced in US dollars.
That point is reinforced by what’s happening in US real yields. While there’s currently no especially strong short-term correlation between real yields and gold, stepping back from the day-to-day relationship gives a pretty stark picture.
Source: LSEG
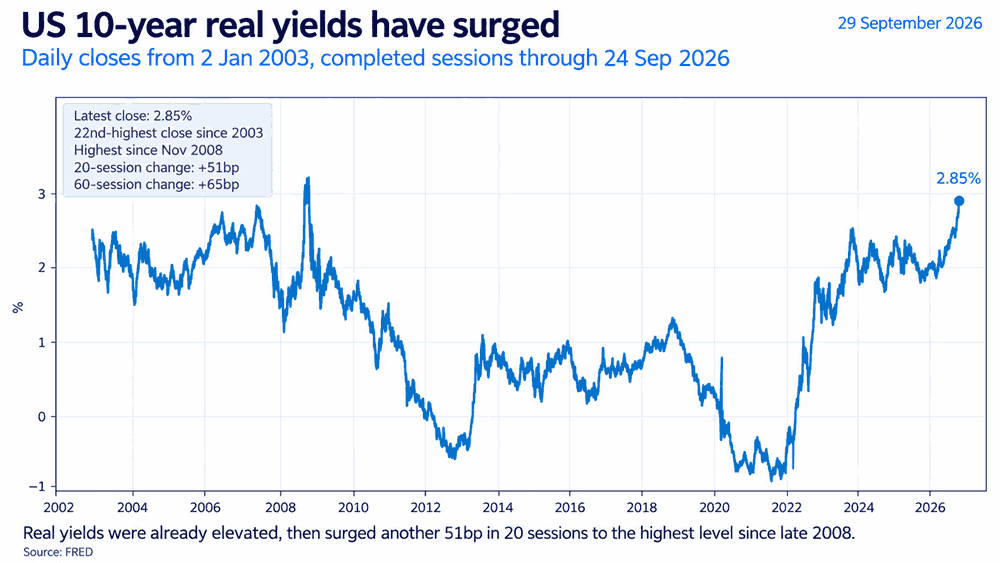
US 10-year real yields, which represent the yield investors can receive over and above the market’s expected average inflation rate over the coming decade, have surged to 2.85%. That’s the highest level since November 2008 and the 22nd-highest daily close in data going back to 2003. The speed of the move has also been extreme, with real yields rising 51 basis points over the past 20 sessions after already starting from historically elevated levels.
Macro remains hostile, but gold is stretched to extremes
Even allowing for the fact that signals from TIPS can be muddied somewhat by the legacy effects of the Fed’s previous quantitative easing programs, it’s difficult to look at that kind of risk-free real return and make anything other than a bearish fundamental case for precious metals, and arguably broader risk assets.
For gold specifically, the question is obvious. When investors can receive nearly 3% in real terms from the US government, how does what has long been perceived to be a safe-haven that offers no yield and is predominantly priced in dollars compete?
When you evaluate the answer, it’s not hard to see why gold is struggling in this environment.
Six prior episodes offer a clue on what may come next
Gold is getting hammered, and arguably for valid, solid fundamental reasons. But macro is one thing, and being extremely oversold is another.
While there’s no evidence of a looming release valve to alleviate the pressure on the precious metals complex, history suggests the prospect of a savage counter-trend rally is not out of the realms of possibility.
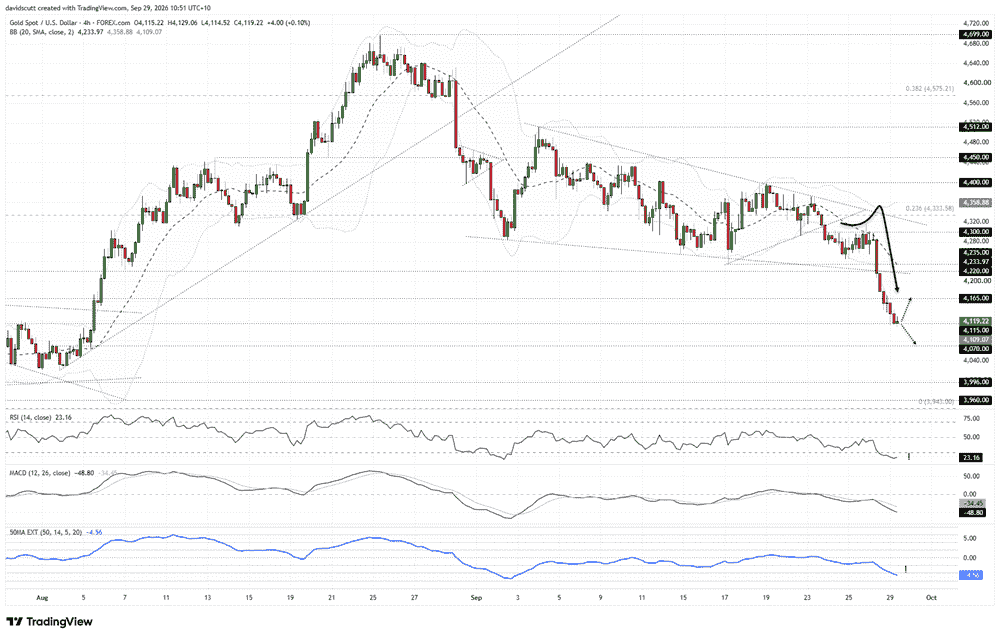
Gold on the four-hourly chart has now got an extreme RSI (14) reading, while the ATR 50 stretch indicator is also extreme. The price was also trading beneath the lower Bollinger Band into the latest close.
Looking visually at the chart, I couldn’t help but notice that when we’ve seen similar conditions in the past, we’ve often seen some pretty big bounces.
So rather than just eyeballing it, I decided to go through the data and back-test what actually happened following previous periods when gold had reached similarly oversold conditions.
Source: TradingView
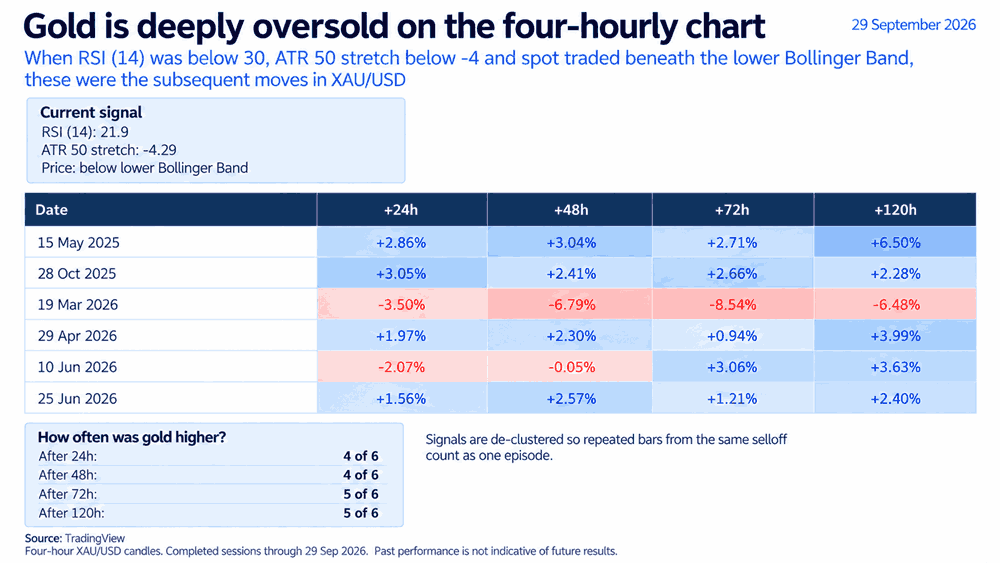
For the back-test, I kept the criteria simple and fixed. I looked for previous four-hourly periods where RSI (14) was below 30, the ATR 50 stretch indicator was below -4, and gold was trading beneath the lower Bollinger Band.
Using those conditions, there were six previous independent episodes in the available history. Of those, gold was higher 24 hours later in four of the six episodes, with the same also seen after 48 hours. By 72 hours and 120 hours, however, it was higher in five of the six.
The obvious exception was March this year, when the liquidation simply kept going and gold continued to unwind. While each large-scale selloff has its own characteristics, that episode was unusual in and of itself, coming after gold had experienced arguably one of the more extreme speculative rallies seen in modern times, taking it to a record high of $5,500 an ounce before the air was let out of the move.
So while that provides a cautionary tale that historic tendencies do not always play out, when you look more broadly, the scope for a near-term bounce against the prevailing trend may be in play.
$4,115 becomes the immediate line in the sand
Source: TradingView
Such was the ferocity of Monday’s breakdown that not only the first but also the second of the two downside targets discussed yesterday were hit, leaving the price dangling just above support at $4,115 an ounce.
That now becomes the immediate focal point for anyone trading gold. Should the prevailing trend extend further, $4,070 an ounce is the next downside level of note, coinciding with an area that acted as both resistance and support in late July and early August this year. Beneath that, a more pronounced support zone kicks in below $4,000, with $3,996, the swing low set in late July, marking the top of the range down to $3,943, the low hit earlier this year.
However, should we see a countertrend bounce form from $4,115, there is scope for the move to push back towards $4,165, the swing high set in late July this year, with $4,220 the next level of note.
A rebound back to that level would likely require some form of major macro news that erodes at least some of the pressure that has been hitting precious metals through higher yields and a strengthening dollar.
Latest market news




The complete CFD trading experience
Award-winning platforms, competitive spreads, low commissions and dedicated support.
We live and breathe the markets and are dedicated to helping traders realise their ambitions as we continue to set the industry bar.
Economic calendar
Web Trader platform
Our sophisticated web-based platform is packed with features.
Related articles
Gold outlook: XAU/USD hammered, stretched and vulnerable to a sharp rebound
Gold is getting hammered for solid fundamental reasons, but history suggests extreme four-hourly oversold conditions can produce violent countertrend rallies.
EUR/USD, USD/JPY Outlook: Oil, yields and an FX identity crisis
Crude oil is setting the tone across rates and FX, leaving EUR/USD vulnerable and USD/JPY caught between higher Treasury yields and the growing threat of intervention
Gold forecast: Rising yields become too hot for gold, but the outlook is far from bearish
Gold and silver prices took a plunge today, with the former down 3% and the latter falling some 5% by mid European session, before bouncing off their lows. The losses come after the metals remained largely supported until last week, despite the big dollar rally and surging bond yields as we have seen in recent weeks. But it simply got too much, and the metals succumbed to pressure today.

StoneX Europe Ltd may make third party material available on this website which may contain information included but not limited to the conditions of financial markets. The material is for information purposes only and does not contain, and should not be construed as containing, investment advice and/or investment recommendation and/or an investment research and/or an offer of or solicitation for any transactions in financial instruments; any decision to enter into a specific transaction shall be made by the client following an assessment by him/her of their situation.
StoneX Europe Ltd makes no representation or warranty and assumes no liability as to the accuracy or completeness of the information provided, nor any loss arising from any investment based on a recommendation, forecast or other information supplied. You should always seek independent advice as to your suitability to speculate in any related markets and your ability to assume the associated risks, if you are at all unsure. We are not under any obligation to update any such material. Any opinion made may be personal to the author and may not reflect the opinion of StoneX Europe Ltd.