






GBP Higher as Brexit Rules
UK Prime Minister Boris Johnson and Ireland Taoiseach Leo Varadar met today.
Share this:

The Great British Pound is higher against most G-10 currencies after UK Prime Minister Boris Johnson and Ireland Taoiseach Leo Varadar met today. The 2 leaders declared they had a positive meeting and that a deal for an orderly Brexit can be done by the end of the month! Although GDP, Industrial Production, and manufacturing data out of the UK were worse than expected, Brexit continues to rule the markets.
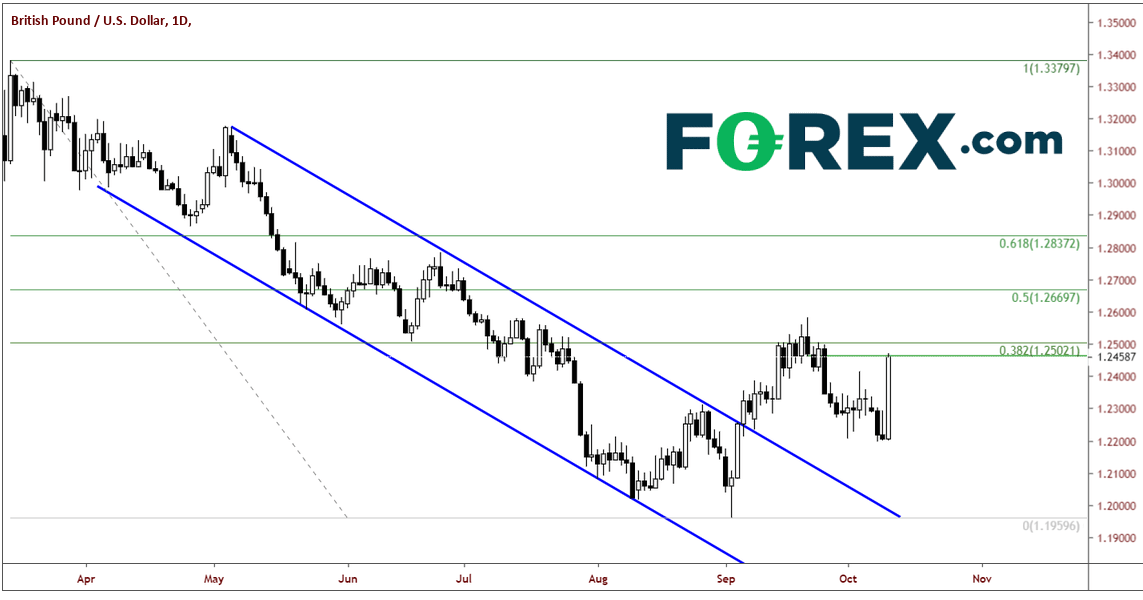
GBP/USD closed up nearly 250 pips on the day, or 2.0%. The pair halted its ascent at the September 20th lows and horizontal resistance and the lows at 1.2460. The 38.2% Fibonacci retracement level from the March 13th high to the September 3rd low sits just above at 1.2500. However, be aware that if a Brexit deal looks more and more likely to get done, GBP/USD could be at 1.3400 in an instant.
Source: Tradingview.com, City Index
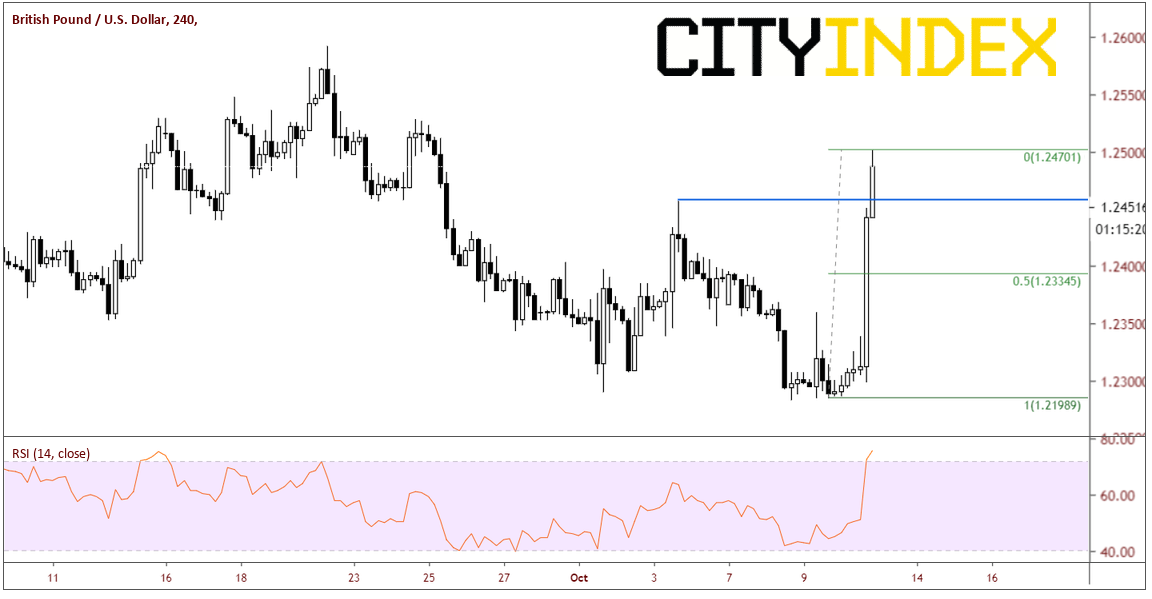
On a 240-minute chart, support is down at 1.2413. Next support is at 1.2335, which is a 50% retracement of today’s move. Don’t read too much into the RSI on the 240 minutes chart, as they tend not to be as reliable during fast markets.
Source: Tradingview.com, City Index
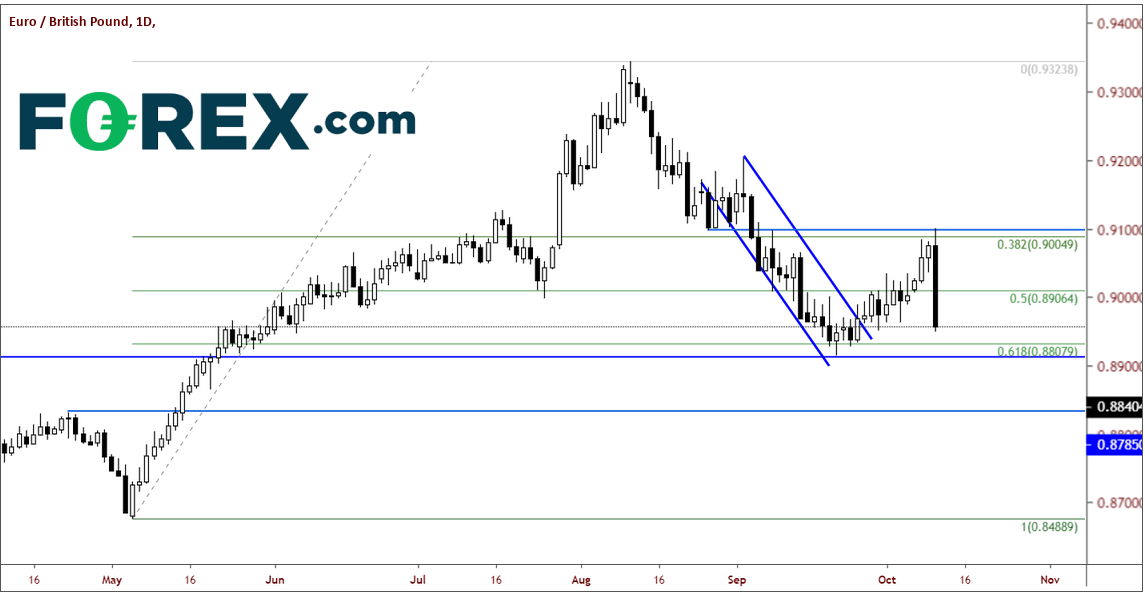
After bouncing around for a few months between the 38.2% Fibonacci retracement level and the 61.8% Fibonacci retracement level from the May 6th lows to the August 12th highs, EUR/GBP ran right into horizontal resistance at .9018 and fell off dramatically from there. Price is back the bottom of the range, closing down 1.7% on the day. First support is the September 20th lows near .8786. Below that, horizontal support comes in at .8982.
Source: Tradingview.com, City Index
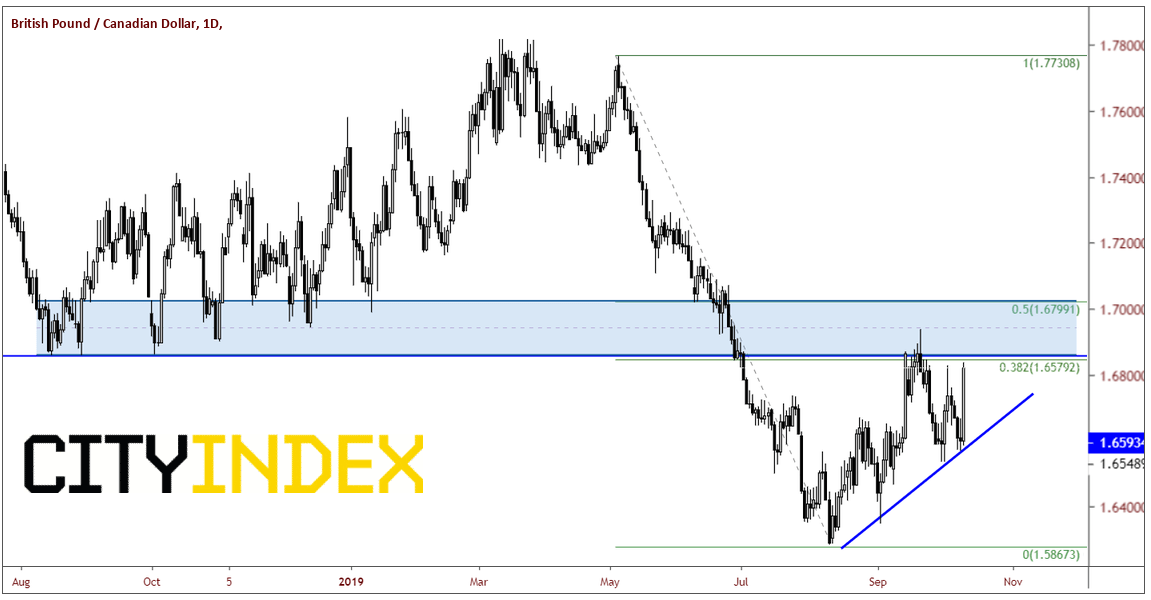
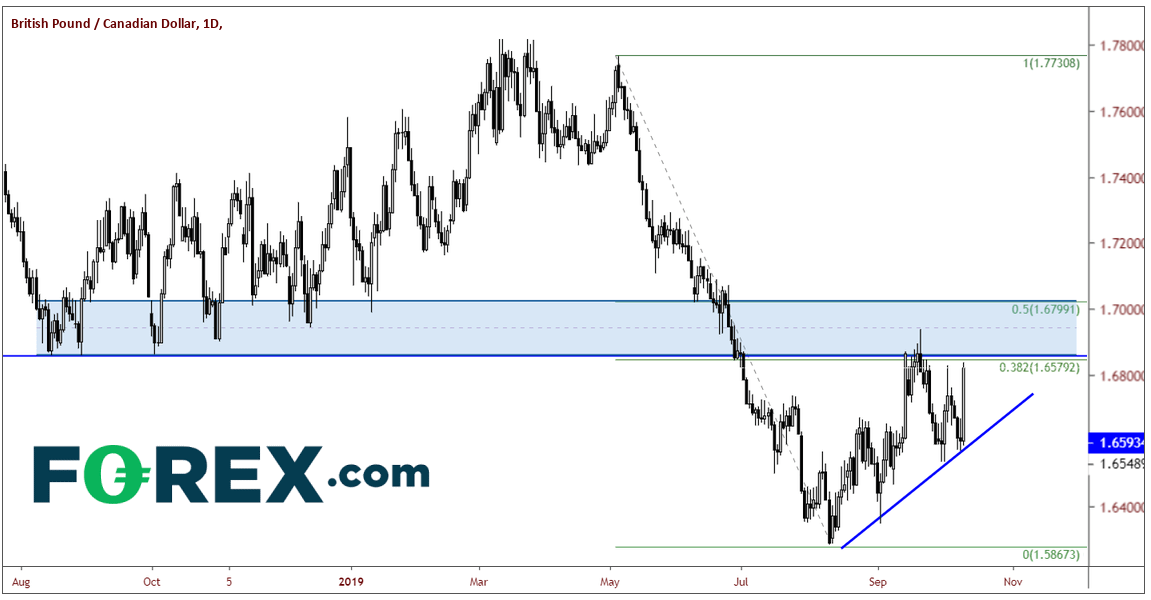
GBP/CAD also traded higher, up 1.8%, near 1.6563. This is just below horizontal resistance and the 38.2% Fibonacci retracement level from the May 3rd high to the August 8th low at 1.6579. There is actually a large resistance zone between the 38.2% and 50% Fibonacci retracement levels, as there are a number of prior lows in that area, which now act as resistance. First support comes in at 1.6403, which is 50% of today’s trading range. Below that, horizontal and trendline support come in near 1.6336.
Source: Tradingview.com, City Index
GBP/AUD and GBP/NZD also closed up nearly 1.5% for the day. Note that these 2 currency pairs will not only be greatly affected by Brexit, but also by US-China trade talks. The Australian dollar and the New Zealand dollar are greatly affected by China. These pairs could remain volatile over the next few weeks!
The Great British Pound is higher against most G-10 currencies after UK Prime Minister Boris Johnson and Ireland Taoiseach Leo Varadar met today. The 2 leaders declared they had a positive meeting and that a deal for an orderly Brexit can be done by the end of the month! Although GDP, Industrial Production, and manufacturing data out of the UK were worse than expected, Brexit continues to rule the markets.
GBP/USD closed up nearly 250 pips on the day, or 2.0%. The pair halted its ascent at the September 20th lows and horizontal resistance and the lows at 1.2460. The 38.2% Fibonacci retracement level from the March 13th high to the September 3rd low sits just above at 1.2500. However, be aware that if a Brexit deal looks more and more likely to get done, GBP/USD could be at 1.3400 in an instant.
Source: Tradingview.com, FOREX.com
On a 240-minute chart, support is down at 1.2413. Next support is at 1.2335, which is a 50% retracement of today’s move. Don’t read too much into the RSI on the 240 minutes chart, as they tend not to be as reliable during fast markets.
Source: Tradingview.com, FOREX.com
After bouncing around for a few months between the 38.2% Fibonacci retracement level and the 61.8% Fibonacci retracement level from the May 6th lows to the August 12th highs, EUR/GBP ran right into horizontal resistance at .9018 and fell off dramatically from there. Price is back the bottom of the range, closing down 1.7% on the day. First support is the September 20th lows near .8786. Below that, horizontal support comes in at .8982.
Source: Tradingview.com, FOREX.com
GBP/CAD also traded higher, up 1.8%, near 1.6563. This is just below horizontal resistance and the 38.2% Fibonacci retracement level from the May 3rd high to the August 8th low at 1.6579. There is actually a large resistance zone between the 38.2% and 50% Fibonacci retracement levels, as there are a number of prior lows in that area, which now act as resistance. First support comes in at 1.6403, which is 50% of today’s trading range. Below that, horizontal and trendline support come in near 1.6336.
Source: Tradingview.com, FOREX.com
GBP/AUD and GBP/NZD also closed up nearly 1.5% for the day. Note that these 2 currency pairs will not only be greatly affected by Brexit, but also by US-China trade talks. The Australian dollar and the New Zealand dollar are greatly affected by China. These pairs could remain volatile over the next few weeks!



The complete CFD trading experience
Award-winning platforms, competitive spreads, low commissions and dedicated support.
We live and breathe the markets and are dedicated to helping traders realise their ambitions as we continue to set the industry bar.
Economic calendar
Web Trader platform
Our sophisticated web-based platform is packed with features.
Related articles

USD/JPY outlook: Hawkish Fed recalibration pressures the yen
Stronger US growth momentum and rising Treasury yields are keeping USD/JPY pointed higher, even as Japanese policymakers try to limit the pressure building across domestic markets.


USD/MXN Forecast: Peso Loses Momentum Ahead of Banxico Decision
Over recent trading sessions, the Mexican peso has started to show signs of losing strength against the U.S. dollar. This can be seen in the performance of USD/MXN, which has gained more than 1.7% over the last three sessions, highlighting the dollar's renewed strength against the peso.


Euro Short-term Outlook: EUR/USD Selloff Nears Critical Yearly Support 9 23 2026
Euro has fallen seven of the past nine sessions, with stretched momentum raising the stakes as EUR/USD closes in on a major inflection zone.

StoneX Europe Ltd may make third party material available on this website which may contain information included but not limited to the conditions of financial markets. The material is for information purposes only and does not contain, and should not be construed as containing, investment advice and/or investment recommendation and/or an investment research and/or an offer of or solicitation for any transactions in financial instruments; any decision to enter into a specific transaction shall be made by the client following an assessment by him/her of their situation.
StoneX Europe Ltd makes no representation or warranty and assumes no liability as to the accuracy or completeness of the information provided, nor any loss arising from any investment based on a recommendation, forecast or other information supplied. You should always seek independent advice as to your suitability to speculate in any related markets and your ability to assume the associated risks, if you are at all unsure. We are not under any obligation to update any such material. Any opinion made may be personal to the author and may not reflect the opinion of StoneX Europe Ltd.