





GBP/USD Forecast: The Pound Drops to Levels Not Seen Since 2023
GBP/USD has recorded six consecutive sessions of declines, approaching the key support at 1.21779, a level not seen since 2023.
Share this:

- GBP/USD has recorded six consecutive sessions of declines, approaching the key support at 1.21779, a level not seen since 2023.
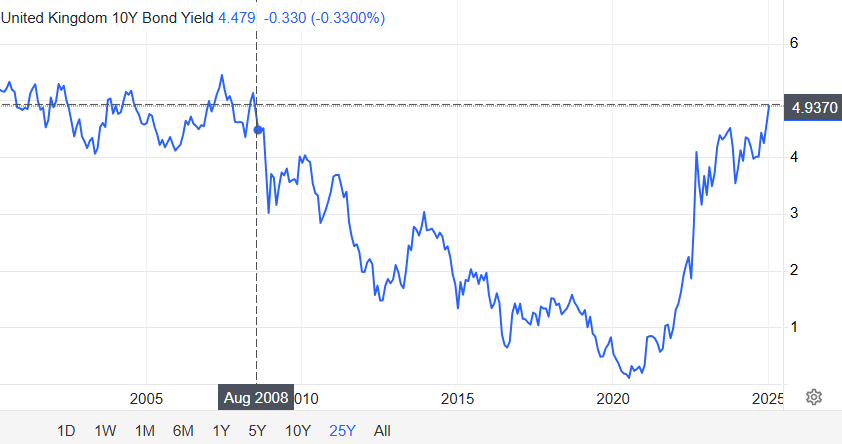
- UK 10-year bond yields have surged to 4.9%, adding short-term pressure on the pound.
Over the last five sessions, the pound has lost enough ground to push the GBP/USD down by approximately 3%. The price is now at a critical support level, primarily due to growing uncertainty stemming from the large-scale bond sell-off in the United Kingdom.
Debt Increase
The UK has experienced a significant sell-off of fixed-income securities, attributed to slow economic growth and high levels of government debt. As a result, 10-year bond yields, which move inversely to the price of the bonds themselves, have climbed to 4.94%, a level not seen since the 2008 financial crisis.
Source: TradingEconomics
Although higher bond yields might seem attractive for international investment, the current context paints a different picture. High yields are perceived as a hindrance to controlling the government’s growing debt levels, which could destabilize plans announced in October 2024 involving tax increases and debt strategies aimed at boosting stable economic growth.
In this scenario, the UK government is not directly responsible for the rising borrowing costs (increased government bond yields), but the situation could further erode confidence in the pound, exerting additional bearish pressure on the GBP/USD. For now, the market views the dollar as a safer option compared to the debt issues plaguing the UK.
GBP/USD Technical Outlook
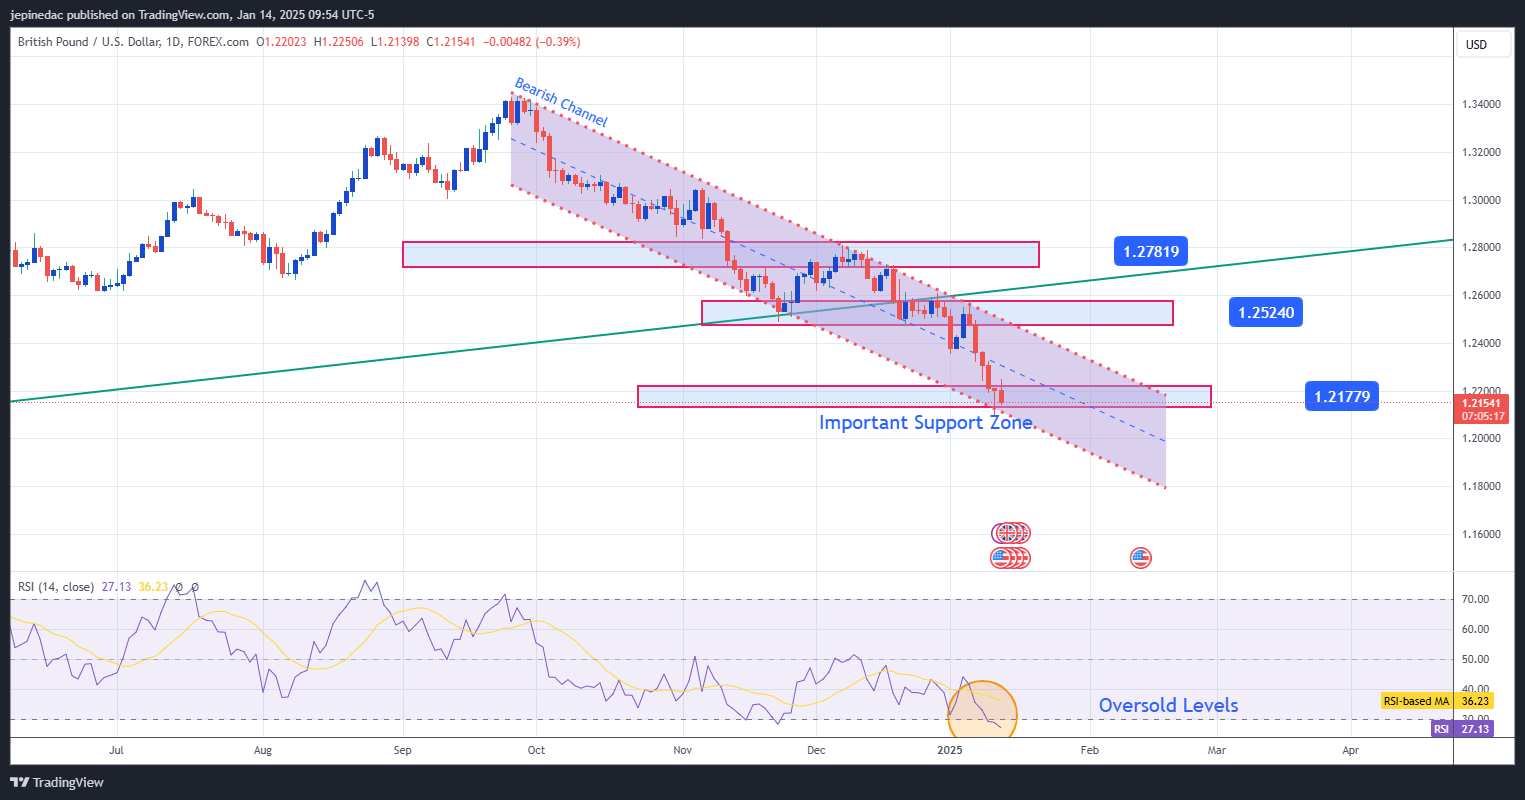
The GBP/USD has logged six consecutive sessions of losses, reflecting the pound's significant weakness. The bearish trend has notably accelerated in the short term.
Source: StoneX, Tradingview
- Bearish Channel: The pair is currently following a clearly defined bearish channel since the September 2024 highs. The strong selling trend has pushed the price to the lower boundary of the channel. If this level is breached, imbalances between supply and demand could trigger temporary bullish corrections.
- RSI Oversold: The RSI has fallen below the 30 level, signaling an oversold condition in the market. This could indicate that the bearish trend has been too steep in the short term, increasing the likelihood of bullish corrections around the current support zone.
Key Levels:
- 1.21779: The most important support level, corresponding to levels of indecision in 2023 and aligned with the lower boundary of the current bearish channel. Sustained oscillations below this level would reinforce the bearish outlook for the coming sessions, intensifying the downtrend on the chart.
- 1.25240: The nearest resistance, located in a neutral zone identified in December 2024 and aligned with the upper boundary of the bearish trendline. Bullish movements toward this area could jeopardize the continuation of the bearish channel and provide an opportunity for a new buying phase in GBP/USD.
Latest market news




The complete CFD trading experience
Award-winning platforms, competitive spreads, low commissions and dedicated support.
We live and breathe the markets and are dedicated to helping traders realise their ambitions as we continue to set the industry bar.
Economic calendar
Web Trader platform
Our sophisticated web-based platform is packed with features.
Related articles

British Pound Technical Outlook: GBP/USD Rebound Challenges September Downtrend 9 30 2026
Sterling has rallied sharply from key support, with GBP/USD at an inflection point that could determine whether a larger recovery is underway.


GBP/USD, Oil Forecast: Two trades to watch 300926
GBP/USD: Can Stronger UK Growth Offset the Dollar’s Advantage? Oil: Supply Recovery Challenges the Geopolitical Premium.

GBP/USD Q4 Outlook: Can the Pound Turn the Tide Against a Hawkish Fed?
GBP/USD hovers around a 3-month low. Can the pound turn the tide against a hawkish Fed or will widening policy divergence keep GBP/USD under pressure in Q4?
StoneX Europe Ltd may make third party material available on this website which may contain information included but not limited to the conditions of financial markets. The material is for information purposes only and does not contain, and should not be construed as containing, investment advice and/or investment recommendation and/or an investment research and/or an offer of or solicitation for any transactions in financial instruments; any decision to enter into a specific transaction shall be made by the client following an assessment by him/her of their situation.
StoneX Europe Ltd makes no representation or warranty and assumes no liability as to the accuracy or completeness of the information provided, nor any loss arising from any investment based on a recommendation, forecast or other information supplied. You should always seek independent advice as to your suitability to speculate in any related markets and your ability to assume the associated risks, if you are at all unsure. We are not under any obligation to update any such material. Any opinion made may be personal to the author and may not reflect the opinion of StoneX Europe Ltd.