







GBPAUD could Reach 2
GBP/AUD is moving higher and could reach near 2.00
Share this:

With all the talk lately about outcome of the elections, Sterling has gone bid vs many of the counter-currencies as it seems the outcome will be favorable to a Brexit deal. While much of the currency talk has been centered around GBP/USD and EUR/GBP, don’t forget Cable vs the Australian Dollar. The Australia Dollar is very sensitive to the US-China trade war. Aussie traders appear to be skeptical that a trade deal is “Done”, and it seems they are waiting for more details to come out before buying Aussie. As a result, GBP/AUD is moving higher and could reach near 2.00, a level not seen since May 2016.
On a weekly chart, GBP/AUD has been trading in an upward sloping channel since October 2016. The pair has retracement 50% of the selloff from the highs in August 2017 to the lows in October 2016. The pair has room within the channel to push higher towards strong resistance between 1.9700 and 2.000, as the weekly RSI is not in overbought conditions.
Source: Tradingview, City Index
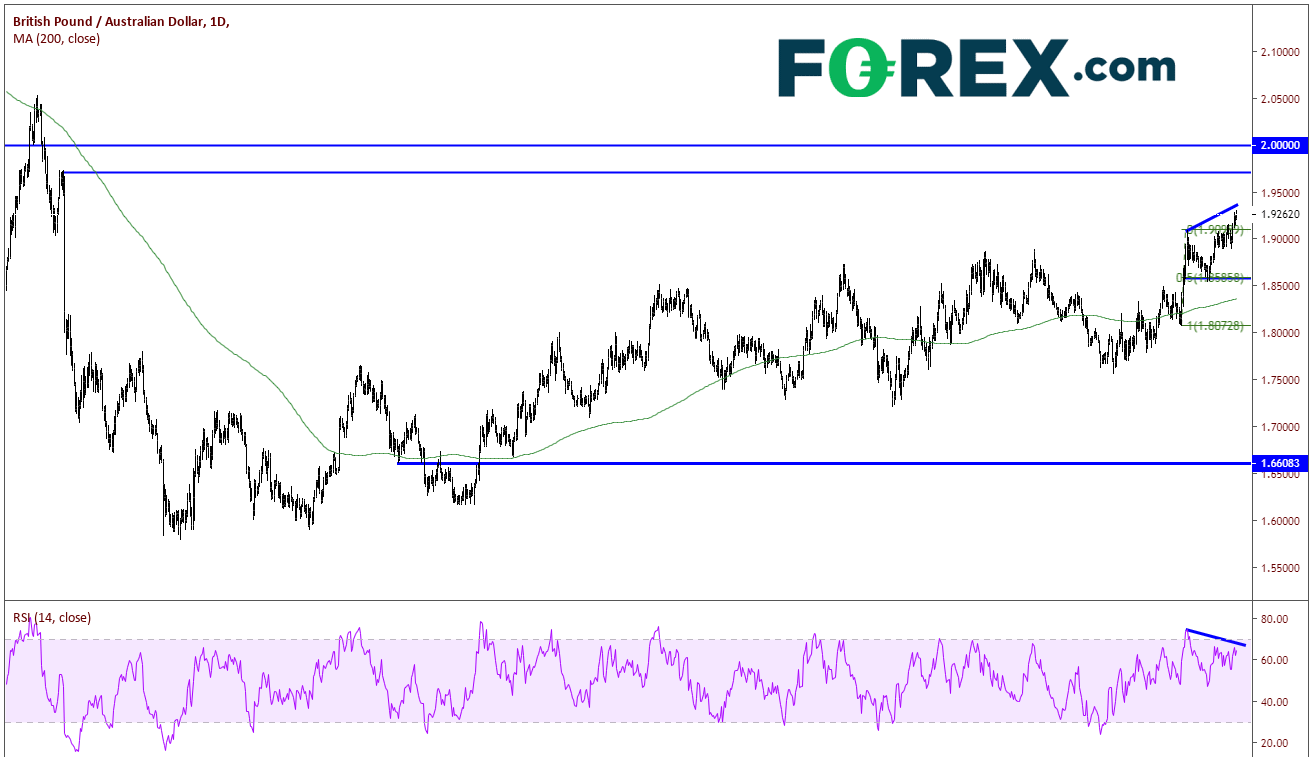
On a daily, the pair held the 50% retracement level from the lows of October 9th to the highs of October 16th, and its move higher. We also can get a better view of the 1.97/2.00 resistance range. 1.9700 was near the highs on June 2016 and 2.000 has been a pivotal point heading back to early 2015 (see weekly). In addition, within that zone of resistance is the 61.8% retracement level from the highs of August 2015 to the lows of October 2016. The top long-term channel trendline also comes across near that level. However, notice that the RSI is beginning to diverge with price, a sign that the pair may not move higher in a straight line.
Source: Tradingview, City Index
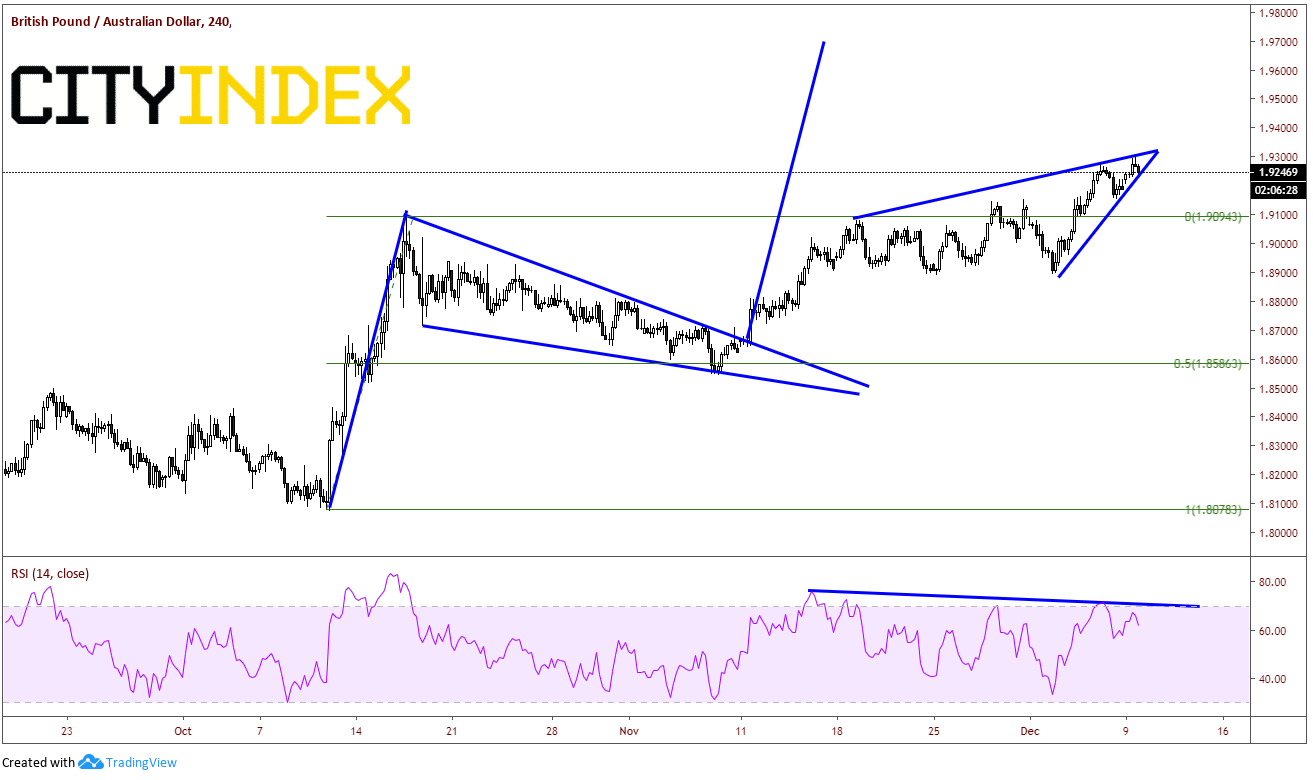
On a 240-minute chart, GBP/AUD formed a bullish pennant formation. The target for a bullish pennant is the length of the flagpole for the pennant added to the point where price broke out of the pennant. In this case, the target is right at the lower end of the resistance zone at 1.9702. Once again, notice that the RSI is diverging with price, so GBP/AUD may get a pullback before moving higher. The is also a small rising wedge which looks ready to break lower. The target for a rising wedge is a 100% retracement of the wedge, which would be near 1.8900. First support is recent lows from December 6th, near 1.9150 and below that price can move down to horizontal support near 1.9100.
Source: Tradingview, City Index
If Johnson wins the election and a majority, GBP/AUD could reach near 2.00 rather quickly. However, most other scenarios will caution buying of Sterling, in general. Also, if a US-China trade deal gets signed by the end of the week or if the December 15th tariffs get delayed, Aussie may go bid. This may result in the pullback GBP/AUD needs in order to unwind the RSI before heading higher.
With all the talk lately about outcome of the elections, Sterling has gone bid vs many of the counter-currencies as it seems the outcome will be favorable to a Brexit deal. While much of the currency talk has been centered around GBP/USD and EUR/GBP, don’t forget Cable vs the Australian Dollar. The Australia Dollar is very sensitive to the US-China trade war. Aussie traders appear to be skeptical that a trade deal is “Done”, and it seems they are waiting for more details to come out before buying Aussie. As a result, GBP/AUD is moving higher and could reach near 2.00, a level not seen since May 2016.
On a weekly chart, GBP/AUD has been trading in an upward sloping channel since October 2016. The pair has retracement 50% of the selloff from the highs in August 2017 to the lows in October 2016. The pair has room within the channel to push higher towards strong resistance between 1.9700 and 2.000, as the weekly RSI is not in overbought conditions.
Source: Tradingview, FOREX.com
On a daily, the pair held the 50% retracement level from the lows of October 9th to the highs of October 16th, and its move higher. We also can get a better view of the 1.97/2.00 resistance range. 1.9700 was near the highs on June 2016 and 2.000 has been a pivotal point heading back to early 2015 (see weekly). In addition, within that zone of resistance is the 61.8% retracement level from the highs of August 2015 to the lows of October 2016. The top long-term channel trendline also comes across near that level. However, notice that the RSI is beginning to diverge with price, a sign that the pair may not move higher in a straight line.
Source: Tradingview, FOREX.com
On a 240-minute chart, GBP/AUD formed a bullish pennant formation. The target for a bullish pennant is the length of the flagpole for the pennant added to the point where price broke out of the pennant. In this case, the target is right at the lower end of the resistance zone at 1.9702. Once again, notice that the RSI is diverging with price, so GBP/AUD may get a pullback before moving higher. The is also a small rising wedge which looks ready to break lower. The target for a rising wedge is a 100% retracement of the wedge, which would be near 1.8900. First support is recent lows from December 6th, near 1.9150 and below that price can move down to horizontal support near 1.9100.
Source: Tradingview, FOREX.com
If Johnson wins the election and a majority, GBP/AUD could reach near 2.00 rather quickly. However, most other scenarios will caution buying of Sterling, in general. Also, if a US-China trade deal gets signed by the end of the week or if the December 15th tariffs get delayed, Aussie may go bid. This may result in the pullback GBP/AUD needs in order to unwind the RSI before heading higher.
Latest market news




The complete CFD trading experience
Award-winning platforms, competitive spreads, low commissions and dedicated support.
We live and breathe the markets and are dedicated to helping traders realise their ambitions as we continue to set the industry bar.
Economic calendar
Web Trader platform
Our sophisticated web-based platform is packed with features.
Related articles
USD/JPY Q4 2026 Outlook: Hawkish Fed Pricing Clashes With Intervention Risk
The year-end tug-of-war is clear: hawkish Fed pricing supports USD/JPY, while intervention risk limits the upside.
Japanese Yen Forecast: USD/JPY 4% Rally Challenges Post-Intervention Downtrend 9 24 2026
USD/JPY momentum has shifted sharply higher, putting a major resistance confluence in focus as U.S. and Japanese event risk builds.


Oil Quietly Hands the Fed a Reason to Stay Hawkish
Oil prices and the U.S. dollar are both on the front foot as elevated energy costs feed Fed warnings that inflation may prove sticky.

StoneX Europe Ltd may make third party material available on this website which may contain information included but not limited to the conditions of financial markets. The material is for information purposes only and does not contain, and should not be construed as containing, investment advice and/or investment recommendation and/or an investment research and/or an offer of or solicitation for any transactions in financial instruments; any decision to enter into a specific transaction shall be made by the client following an assessment by him/her of their situation.
StoneX Europe Ltd makes no representation or warranty and assumes no liability as to the accuracy or completeness of the information provided, nor any loss arising from any investment based on a recommendation, forecast or other information supplied. You should always seek independent advice as to your suitability to speculate in any related markets and your ability to assume the associated risks, if you are at all unsure. We are not under any obligation to update any such material. Any opinion made may be personal to the author and may not reflect the opinion of StoneX Europe Ltd.