





GBPUSD Breaks Its 52 Week Low Has That Provided An Edge In The Past
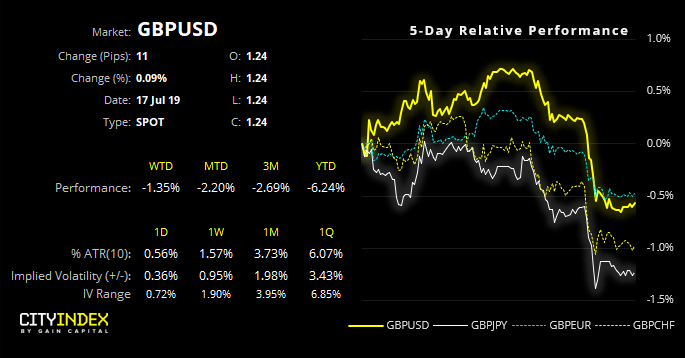
To be more precise, GBP/USD has actually closed to a 25-month low. But having recently tested how the S&P500 responded to its 52-week milestone, we extend our curiosity to cable.
Share this:

Source: Eikon, City Index
To be more precise, GBP/USD has actually closed to a 25-month low. But having recently tested how the S&P500 responded to its 52-week milestone, we extend our curiosity the cable.
Brexit woes have continued to weigh on GBP, with reports of Boris Johnson suggesting parliament will be suspended and declaring the Irish Backstop to be “dead”. However, a strong USD following positive retails sales has also played its part to push cable decisively lower.
Source: Eikon, City Index
Technically and fundamentally, it appears further downside for cable is on the horizon. As highlighted in this week’s COT report, traders remain decisively bearish yet not at historically extreme levels. On the daily chart, its trend structure remains decisively bearish and yesterday’s close made little effort of the 2019 support level.
Whilst support could be found around the April 2017 low, we remain bearish beneath the 1.2579 swing high and the trend structure would assume an eventual break lower. That said, we’d suggest keeping an eye on bullish reversal patterns back above support (such as bullish pinbar on the daily) as this could warn of a bear-trap and hesitancy to break the 1.2366 low.
However, given we tested the S&P500’s performance around a 52-week high, we’d like to quantify GBP/USD’s past performance around a similar milestone. Please note, as this is a research piece, we’ll be assessing price action characteristics and therefore not producing a full trading system.
Entry criteria: Enter short when prices close to a fresh 52-week low
Portfolio: $10,000
Trades: Max 1 trade at a time
Exit after: 4 Days holding (including entry day)
To avoid bombarding you with charts and numbers, we initially ran an optimisation to find the ‘most ideal’ hold time (between 1-10 days) in relation to maximum profit and minimum drawdown. The results suggested 4 days was the optimum hold time for this entry criteria.

Source: Eikon, City Index
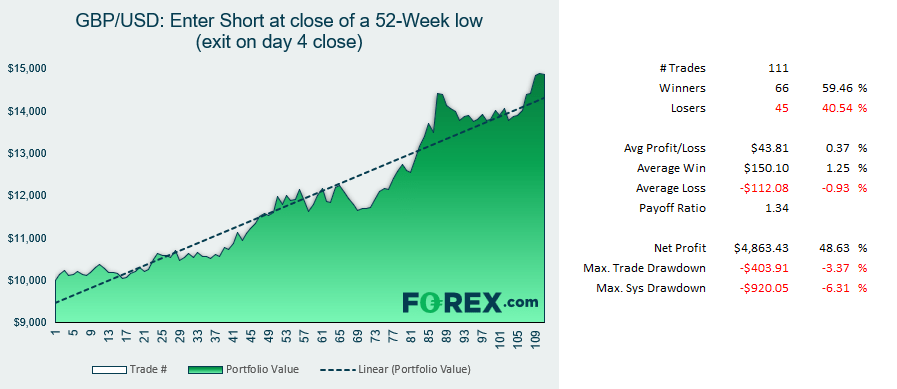
Upon first-glance, the numbers appear promising:
- Steadily rising equity curve with relatively minor drawdown
- Nearly 60% winners
- Average winners are larger than averages losses
However, these numbers can and do mask the realities of trading a live account (especially one without a stop-loss). For example, the tests ignore transaction fees and the liquidity of a live market, which makes the results appear more favourable. But, if we dig a little deeper and look at maximum intraday loss/gain, we get a better feel for the volatility that needs to be accounted for.
Source: Eikon, City Index
Maximum intraday loss/gain shows the most extreme level of a trade before it was closed. Whilst the average intraday loss and gain are -1.17% and +1.2% respectively, we can see an intraday swing of -9.8% going against a trade more recently which is not likely for the feint hearted.
The obvious solution here is to include a stop loss to protect your capital, as the cost of eroding upside potential. However, full-system design is outside the scope of this research article, but we hope it fulfils its objective in showing something valuable for your own research.
Related Analysis:
US Indices Closed At New Highs: Do We Hold Or Fold?
Bitcoin: Do Volatile Bullish Sessions Lead To Further Gains?
Source: Eikon, FOREX.com
To be more precise, GBP/USD has actually closed to a 25-month low. But having recently tested how the S&P500 responded to its 52-week milestone, we extend our curiosity the cable.
Brexit woes have continued to weigh on GBP, with reports of Boris Johnson suggesting parliament will be suspended and declaring the Irish Backstop to be “dead”. However, a strong USD following positive retails sales has also played its part to push cable decisively lower.
Source: Eikon, FOREX.com
Technically and fundamentally, it appears further downside for cable is on the horizon. Traders remain decisively bearish yet not at historically extreme levels. On the daily chart, its trend structure remains decisively bearish and yesterday’s close made little effort of the 2019 support level.
Whilst support could be found around the April 2017 low, we remain bearish beneath the 1.2579 swing high and the trend structure would assume an eventual break lower. That said, we’d suggest keeping an eye on bullish reversal patterns back above support (such as bullish pinbar on the daily) as this could warn of a bear-trap and hesitancy to break the 1.2366 low.
However, given we tested the S&P500’s performance around a 52-week high, we’d like to quantify GBP/USD’s past performance around a similar milestone. Please note, as this is a research piece, we’ll be assessing price action characteristics and therefore not producing a full trading system.
Entry criteria: Enter short when prices close to a fresh 52-week low
Portfolio: $10,000
Trades: Max 1 trade at a time
Exit after: 4 Days holding (including entry day)
To avoid bombarding you with charts and numbers, we initially ran an optimisation to find the ‘most ideal’ hold time (between 1-10 days) in relation to maximum profit and minimum drawdown. The results suggested 4 days was the optimum hold time for this entry criteria.
Source: Eikon, FOREX.com
Upon first-glance, the numbers appear promising:
- Steadily rising equity curve with relatively minor drawdown
- Nearly 60% winners
- Average winners are larger than averages losses
However, these numbers can and do mask the realities of trading a live account (especially one without a stop-loss). For example, the tests ignore transaction fees and the liquidity of a live market, which makes the results appear more favourable. But, if we dig a little deeper and look at maximum intraday loss/gain, we get a better feel for the volatility that needs to be accounted for.
Source: Eikon, FOREX.com
Maximum intraday loss/gain shows the most extreme level of a trade before it was closed. Whilst the average intraday loss and gain are -1.17% and +1.2% respectively, we can see an intraday swing of -9.8% going against a trade more recently which is not likely for the feint hearted.
The obvious solution here is to include a stop loss to protect your capital, as the cost of eroding upside potential. However, full-system design is outside the scope of this research article, but we hope it fulfils its objective in showing something valuable for your own research.




The complete CFD trading experience
Award-winning platforms, competitive spreads, low commissions and dedicated support.
We live and breathe the markets and are dedicated to helping traders realise their ambitions as we continue to set the industry bar.
Economic calendar
Web Trader platform
Our sophisticated web-based platform is packed with features.
Related articles

EUR/USD Forecast: Euro Extends Losses Ahead of Fed Rate Decision
The euro has started to face a more challenging period in the short term. The EUR/USD pair has already declined by nearly 0.81% over the last four trading sessions, a move that has begun to reinforce a meaningful bearish bias in favor of the U.S. dollar.


Gold, Silver, DXY Outlook: Charts Test Defining Support Levels
Gold, Silver, DXY Outlook: Charts test defining support levels as crude oil prices hold above $100, U.S. Treasury yields move higher and hawkish FOMC risks come into focus. Key scenarios to watch.


Dow Jones Forecast: DJIA tumbles as Oil hits $100
U.S. stocks are pointing to a lower open as oil prices breach $100 a barrel for the first time since July, amid deepening tensions in the Middle East. Investors also remain cautious ahead of inflation data later in the week.

StoneX Europe Ltd may make third party material available on this website which may contain information included but not limited to the conditions of financial markets. The material is for information purposes only and does not contain, and should not be construed as containing, investment advice and/or investment recommendation and/or an investment research and/or an offer of or solicitation for any transactions in financial instruments; any decision to enter into a specific transaction shall be made by the client following an assessment by him/her of their situation.
StoneX Europe Ltd makes no representation or warranty and assumes no liability as to the accuracy or completeness of the information provided, nor any loss arising from any investment based on a recommendation, forecast or other information supplied. You should always seek independent advice as to your suitability to speculate in any related markets and your ability to assume the associated risks, if you are at all unsure. We are not under any obligation to update any such material. Any opinion made may be personal to the author and may not reflect the opinion of StoneX Europe Ltd.