






Gold Is it still a flight to safety
Traders may be waiting until after the FOMC meeting to decide what to do with Gold
Share this:

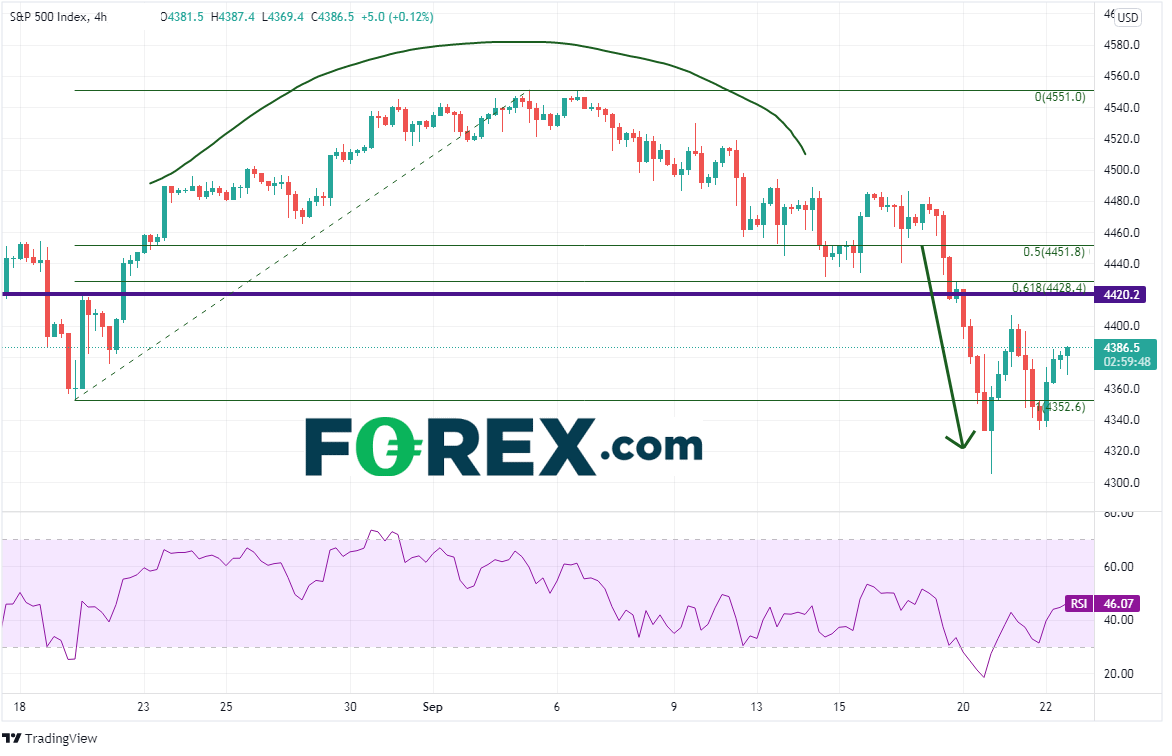
On Monday, majority US equity indices were hit hard, with their biggest one-day selloff in months. The S&P 500 closed -73.50 on the day, the Dow Jones Industrials were -614, and the NASDAQ 100 was -316.50. All broke through key support areas and are below their respective 50 Day Moving Averages. As one may expect, the flight to safety trade was on, as both the Japanese Yen and the Swiss Franc were the big winners of the day. USD/JPY was -60 pips and USD/CHF reversed the prior day’s gains, -51 pips on the day. Interestingly, and maybe telling, Bitcoin sold off with risk. The cryptocurrency was -4209 on the day, or -8.91%. BTC was NOT a flight to safety on Monday. (Did the stock selloff lead to margin calls, which led to Bitcoin selling to raise cash?) The arrow on the chart below shows Monday’s price action in the S&P 500:
Source: Tradingview, Stone X
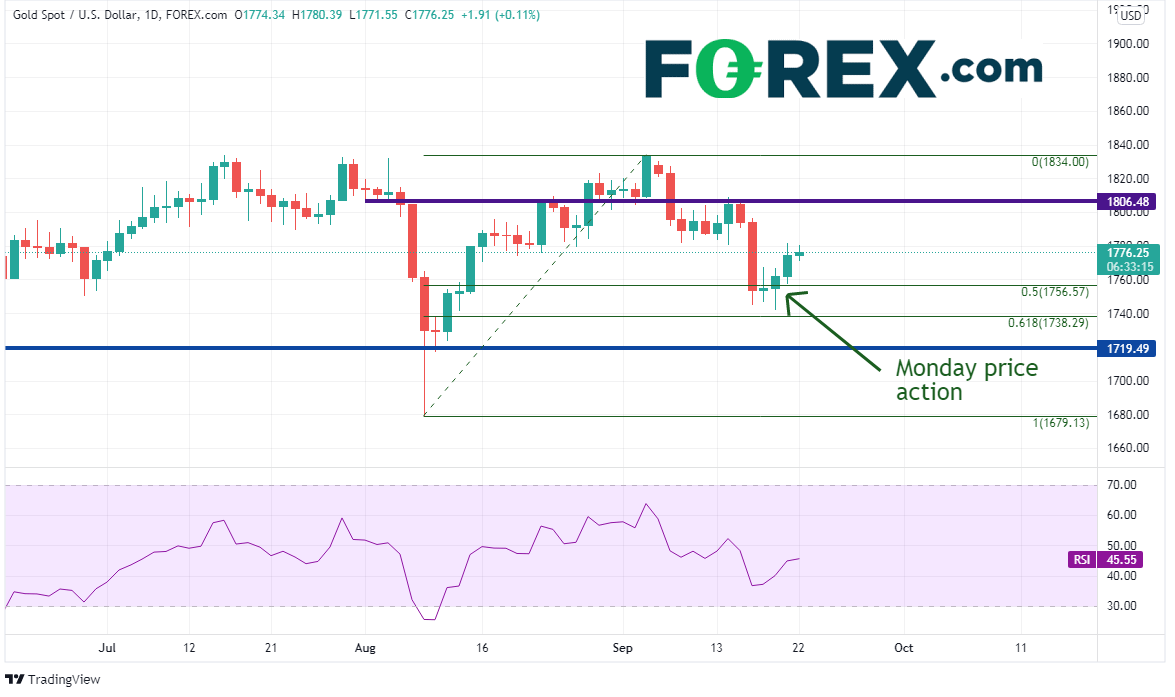
And with the traditional flight to safety assets gaining strength on Monday (Yen and Swiss Franc), naturally Gold (XAU/USD) would have a large positive day as well. Right? Not exactly. Gold did close higher on Monday, however, it only closed +6.94. This is a relatively small move higher compared to the selloff in stock indices. As a matter of fact, Gold was +12.52 on Tuesday as the S&P500 was +5.00 on the day!
Source: Tradingview, Stone X
This means that the selloff in stocks on Monday may have just been profit taking near all-time highs in stock indices ahead of the FOMC meeting. However, that doesn’t mean Gold isn’t a safe haven anymore. Traders may be waiting until after the FOMC meeting to decide what to do with Gold. However, looking at a daily timeframe, Gold had been selling off since the August 2020 highs, making lower highs. However, in early September, that trend may have begun to change, as price tested the late July highs near 1834. Price appears to be forming an inverse head and shoulders pattern, with the neckline at 1834. If price does move higher, the target is near 1992, and possibly even the all-time highs at 2075.
Source: Tradingview, Stone X
However, if price is to get through the neckline, it must first pass through the 50-and 200- Day Moving Averages at 1793.72 and 1806.17, respectively. In addition, the 50% retracement level and the 61.8% Fibonacci retracement level from the August 2020 highs to the August 9th lows are at 1877.68 and 1924.27, respectively. If price does fail to move higher, support is at the September 20th lows of 1742.22 and the August 9th spike lows 1679.13.
Given the (non) move in Gold on Monday, the stock market selloff on may have simply been profit taking head of the FOMC meeting. However, if stocks do continue lower after the meeting, that may signal a change and Gold may return to the more popular investment vehicle as a flight to safety.
Learn more about gold and silver trading opportunities.
On Monday, majority US equity indices were hit hard, with their biggest one-day selloff in months. The S&P 500 closed -73.50 on the day, the Dow Jones Industrials were -614, and the NASDAQ 100 was -316.50. All broke through key support areas and are below their respective 50 Day Moving Averages. As one may expect, the flight to safety trade was on, as both the Japanese Yen and the Swiss Franc were the big winners of the day. USD/JPY was -60 pips and USD/CHF reversed the prior day’s gains, -51 pips on the day. Interestingly, and maybe telling, Bitcoin sold off with risk. The cryptocurrency was -4209 on the day, or -8.91%. BTC was NOT a flight to safety on Monday. (Did the stock selloff lead to margin calls, which led to Bitcoin selling to raise cash?) The arrow on the chart below shows Monday’s price action in the S&P 500:
Source: Tradingview, Stone X
And with the traditional flight to safety assets gaining strength on Monday (Yen and Swiss Franc), naturally Gold (XAU/USD) would have a large positive day as well. Right? Not exactly. Gold did close higher on Monday, however, it only closed +6.94. This is a relatively small move higher compared to the selloff in stock indices. As a matter of fact, Gold was +12.52 on Tuesday as the S&P500 was +5.00 on the day!
Source: Tradingview, Stone X
This means that the selloff in stocks on Monday may have just been profit taking near all-time highs in stock indices ahead of the FOMC meeting. However, that doesn’t mean Gold isn’t a safe haven anymore. Traders may be waiting until after the FOMC meeting to decide what to do with Gold. However, looking at a daily timeframe, Gold had been selling off since the August 2020 highs, making lower highs. However, in early September, that trend may have begun to change, as price tested the late July highs near 1834. Price appears to be forming an inverse head and shoulders pattern, with the neckline at 1834. If price does move higher, the target is near 1992, and possibly even the all-time highs at 2075.
Source: Tradingview, Stone X
However, if price is to get through the neckline, it must first pass through the 50-and 200- Day Moving Averages at 1793.72 and 1806.17, respectively. In addition, the 50% retracement level and the 61.8% Fibonacci retracement level from the August 2020 highs to the August 9th lows are at 1877.68 and 1924.27, respectively. If price does fail to move higher, support is at the September 20th lows of 1742.22 and the August 9th spike lows 1679.13.
Given the (non) move in Gold on Monday, the stock market selloff on may have simply been profit taking head of the FOMC meeting. However, if stocks do continue lower after the meeting, that may signal a change and Gold may return to the more popular investment vehicle as a flight to safety.
Learn more about gold and silver trading opportunities.
Related tags:


The complete CFD trading experience
Award-winning platforms, competitive spreads, low commissions and dedicated support.
We live and breathe the markets and are dedicated to helping traders realise their ambitions as we continue to set the industry bar.
Economic calendar
Web Trader platform
Our sophisticated web-based platform is packed with features.
Related articles

Gold forecast: XAU/USD could take a larger dive after the big rise in yields
Gold prices have been falling in the last few days after last week’s post-FOMC pop faded amid rising interest rate expectations, higher oil prices and a strengthening US dollar. As before, I wasn’t convinced gold would thrive in the current macro backdrop.


Gold, silver slammed as hawkish Fed repricing reignites dollar upside
Gold and silver had held up surprisingly well against surging US yields. Wednesday’s DXY breakout may have changed that equation.


Euro Short-term Outlook: EUR/USD Selloff Nears Critical Yearly Support 9 23 2026
Euro has fallen seven of the past nine sessions, with stretched momentum raising the stakes as EUR/USD closes in on a major inflection zone.

StoneX Europe Ltd may make third party material available on this website which may contain information included but not limited to the conditions of financial markets. The material is for information purposes only and does not contain, and should not be construed as containing, investment advice and/or investment recommendation and/or an investment research and/or an offer of or solicitation for any transactions in financial instruments; any decision to enter into a specific transaction shall be made by the client following an assessment by him/her of their situation.
StoneX Europe Ltd makes no representation or warranty and assumes no liability as to the accuracy or completeness of the information provided, nor any loss arising from any investment based on a recommendation, forecast or other information supplied. You should always seek independent advice as to your suitability to speculate in any related markets and your ability to assume the associated risks, if you are at all unsure. We are not under any obligation to update any such material. Any opinion made may be personal to the author and may not reflect the opinion of StoneX Europe Ltd.