



Gold Analysis: It looks tough at the top for gold
Gold has continued to hit the headlines as it teases investors with a record high. But that doesn’t mean gains will be plain sailing from here, even if we remain bullish this year overall.
Share this:

It’s been a good year for gold, with spot prices having risen ~11.4% YTD and over 28% from the November low to YTD high. And it has the potential to remain a good year for gold overall, with central banks continuing to pile into the metal whilst increased demand from China and India are also expected to help. The Fed are in pause mode which is supressing the US dollar and yields, whilst concerns of an economic slowdown and a standoff over the US debt ceiling are also providing gold with safe-haven flows.
But whilst that means we could see gold break to new highs it does not mean it will be a smooth sailing rally, given we’re in a seasonal period where returns can be less reliable.
Gold weekly and daily chart:

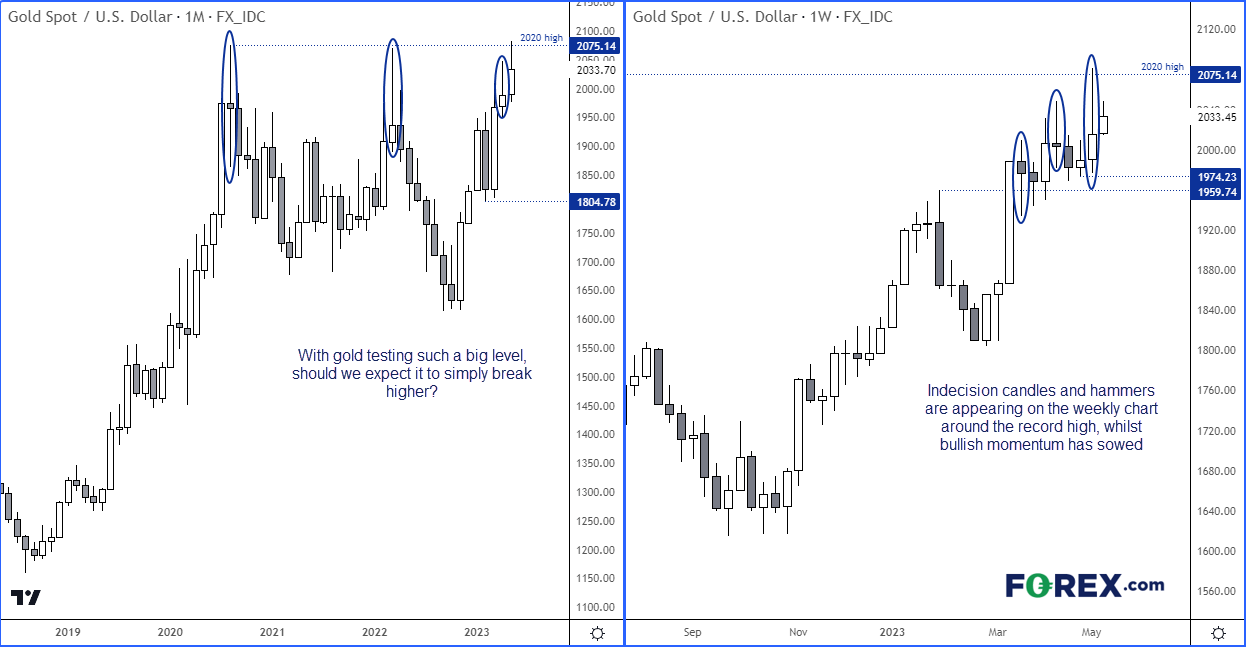
The monthly chart on the left shows a strong rally into the 2020 high but note that the 2075 area provided two distinct tops in 2020 (spinning top Doji) and 2022 (bearish hammer). Also note the smaller bearish hammer in April which failed to retest the 2022 high, and this month’s candle is also in the process of forming an upper wick as prices retreat.
A look at the weekly chart on the left shows that bullish momentum has waned as choppy price action ensued, with significant overlap of the weekly ranges these past seven weeks. Furthermore, an elongated bearish hammer formed last week and price action is trading within a tight range, below the 2020 high within last week’s range.
There’s clearly some nervousness at these highs. And it likely spells trouble that a record high was achieved last week during low-liquidity trade whist oil prices slumped to a 17-month low before both markets promptly reversed their moves. That is certainly not a ‘happy high’ for gold which suggests there are underlying concerns and investors are quick to over-react. And likely not helping is that returns in May are less stable than other months, according to its seasonal pattern of the past 30 years.
Gold 30-year seasonal chart:


- Average returns for gold in May over the past 30 years I just 0.03%
- Gold has closed lower in May 51.7% of the time over the past 30 years
- Average positive returns were 3.5% whilst negative returns were -3.2% over this period in May
- The average return over the past 10 years in May is -0.7%, whilst is has risen 1.6% on average over the past 5
- Overall, the relationship between average returns in May and positive expectancy are weak relative to some other months
Is Gold ready to rise to new highs on the US bank crisis or debt ceiling issues?
Should the banking crisis remain in the rear-view mirror, gold traders can focus on traditional economic data to decipher Fed policy. But gold is likely to attract further safe-haven flows if new banks begin crumble. Yet whilst gold can act as a safe-haven in times of uncertainty, it’s not necessarily the case during a full blown crisis as investors head for the exit and switch to cash. A tell-tale sign of true risk-off is to see yields spike whilst equity markets crash with gold. And if we’re to see a credit crunch and a financial meltdown similar to 2008, gold could fall with everything else. Initially, at least initially.
The debt ceiling debacle seems to have thrown a floor under gold prices. But that’s not to say it may sell off sharply should the ceiling be raised whilst the Fed are in pause mode and investors are on the hunt for weak US data.
Ultimately, we suggest traders remain nimble around these highs and not take for granted that a new record high will lead to a sustained rally northwards. We’ve seen some really fickle price action up to and beyond $2050 over the past week, and that tells me gold is not quite ready for the big break. Whilst gold remains supported overall, it doesn’t look overlay happy at these highs and investors seem quick to book profits with any break above $2050 for now.
Gold daily chart:

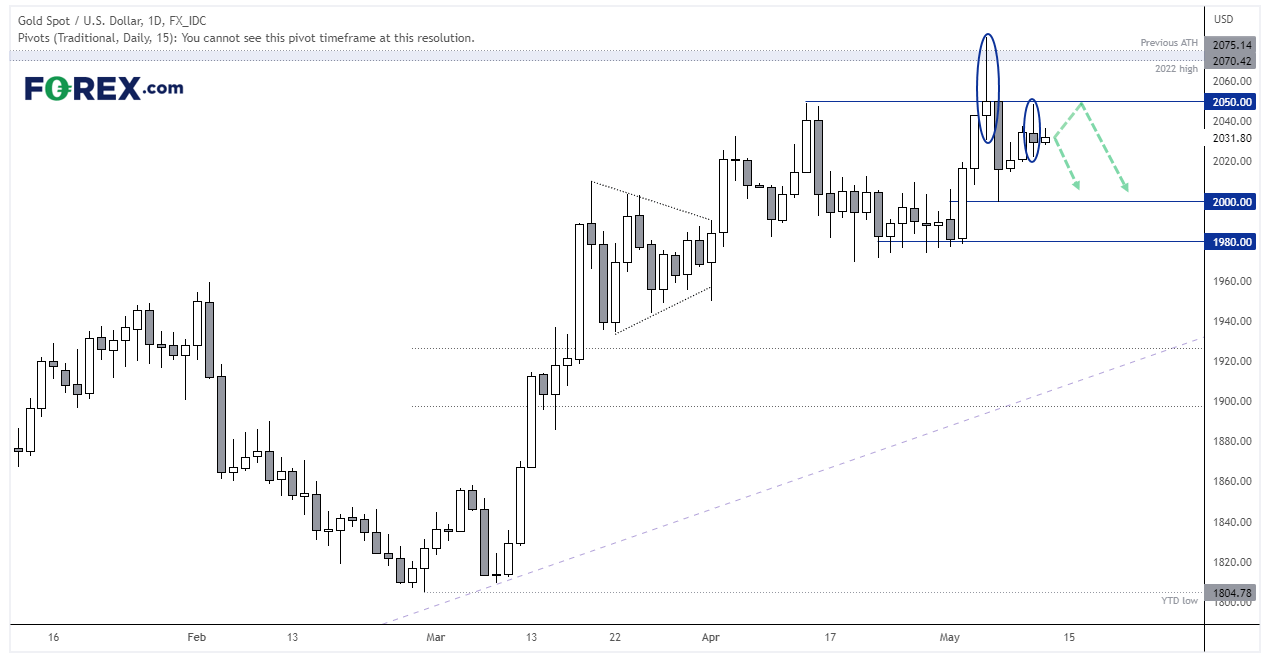
2050 is clearly an important level for traders, given the false break above it (and the 2020 high) resulted in a quick reversal below it with a bearish hammer on the daily chart. The level has since provided resistance with a spinning top Doji and volatility remains low, so we prefer to fade into moves below $2050 unless a macro-driven event justifies a break above it.
Gold 5-minute chart:
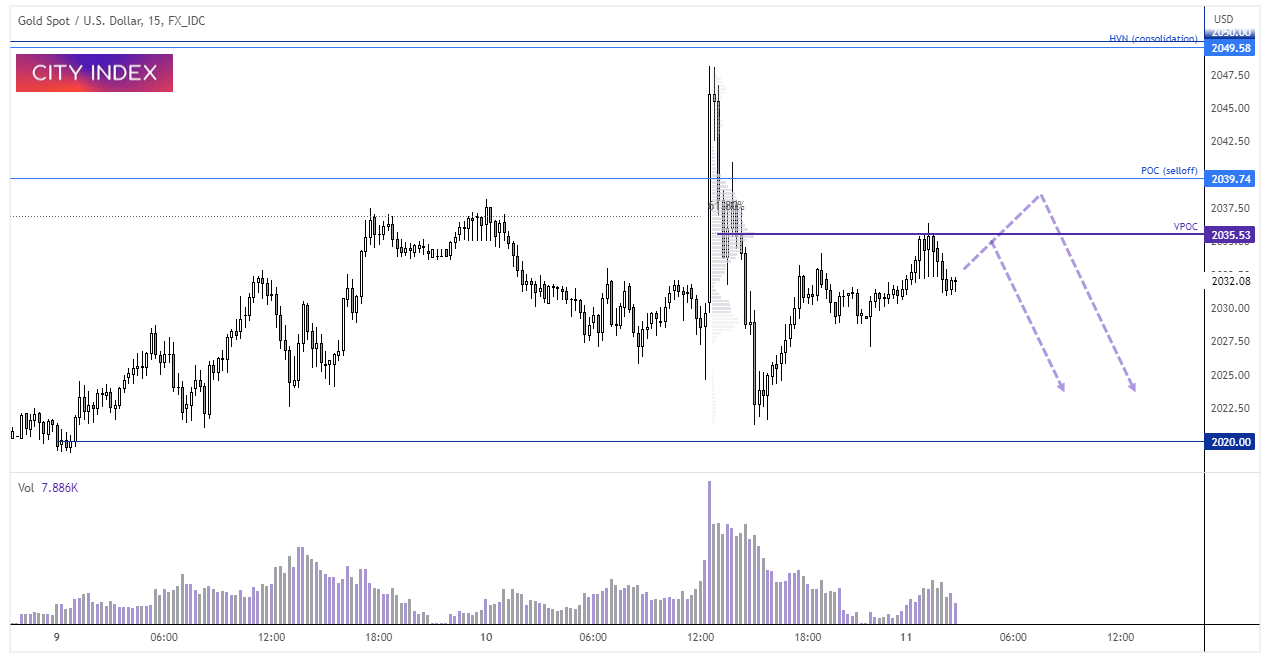

Prices have drifted higher from 2,000 with lower volumes to the bearish move which preceded it, suggesting the rise is a retracement. Resistance has been found around 2035, which is the VPOC (volume point of control) of the selloff from yesterday’s high. We prefer to fade into minor rallies up to or around 2035, with a break above 2040 invalidating the near-term bearish bias.
-- Written by Matt Simpson
Follow Matt on Twitter @cLeverEdge
How to trade with City Index
You can trade with City Index by following these four easy steps:
- Open an account, or log in if you’re already a customer
• Open an account in the UK
• Open an account in Australia
• Open an account in Singapore
- Search for the market you want to trade in our award-winning platform
- Choose your position and size, and your stop and limit levels
- Place the trade
Related tags:


The complete CFD trading experience
Award-winning platforms, competitive spreads, low commissions and dedicated support.
We live and breathe the markets and are dedicated to helping traders realise their ambitions as we continue to set the industry bar.
Economic calendar
Web Trader platform
Our sophisticated web-based platform is packed with features.
Related articles

Nikkei breakout accelerates as yen weakness returns
Nikkei has started October with a powerful breakout, helped by renewed yen weakness and strong upside momentum


Gold Price Outlook: XAU/USD Resistance at $4200 Sets Up for NFP
It was a strong sell-off to start the week in gold and despite a Tuesday bounce, sellers are continuing to push following a resistance hit at the $4200 level.


The RBA Hiked Rates and the Australian Dollar Still Fell
AUD/USD fell after the RBA rate hike because the central bank's hawkish stance was already priced in while the U.S. dollar stayed firm.

StoneX Europe Ltd may make third party material available on this website which may contain information included but not limited to the conditions of financial markets. The material is for information purposes only and does not contain, and should not be construed as containing, investment advice and/or investment recommendation and/or an investment research and/or an offer of or solicitation for any transactions in financial instruments; any decision to enter into a specific transaction shall be made by the client following an assessment by him/her of their situation.
StoneX Europe Ltd makes no representation or warranty and assumes no liability as to the accuracy or completeness of the information provided, nor any loss arising from any investment based on a recommendation, forecast or other information supplied. You should always seek independent advice as to your suitability to speculate in any related markets and your ability to assume the associated risks, if you are at all unsure. We are not under any obligation to update any such material. Any opinion made may be personal to the author and may not reflect the opinion of StoneX Europe Ltd.