




Gold correction likely
After a 4-month rally, the precious metal looks overbought and could be in for a correction of some sort.
Share this:

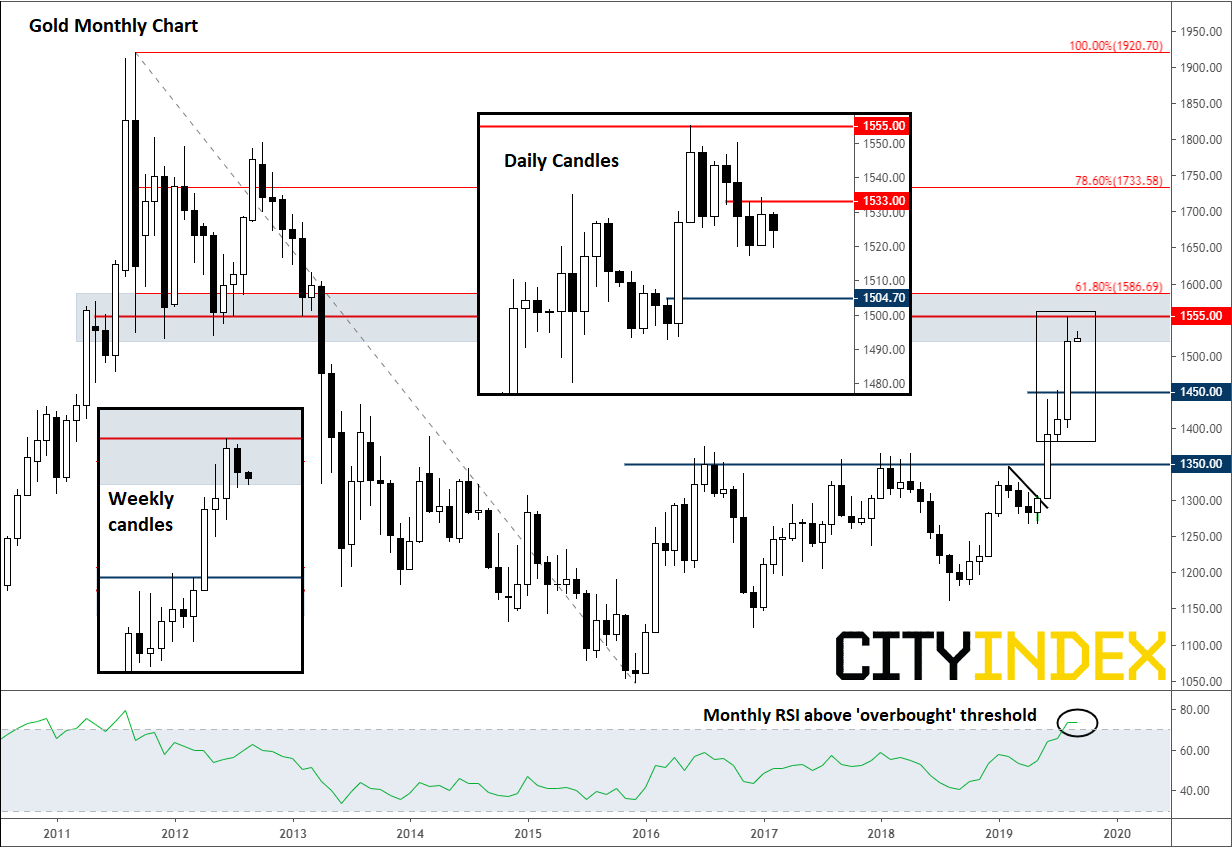
Gold has risen sharply ever since bottoming out at $1160 in August 2018, with the rally gaining renewed momentum in May this year. But after a 4-month rally, the precious metal looks overbought and could be in for a correction of some sort. This won’t necessarily be a bad thing as it would reduce short-term technical overbought conditions. However, while the metal has hit key resistance in the $1555 area, it is yet to show a clear bearish reversal sign. Still, given the following considerations, I favour the downside for now:
- The Dollar Index has hit a new high on the year and is up for the 4th consecutive day. The greenback has been supported thanks mainly to weakness in European currencies with the euro, pound and franc all losing out in recent days. Commodity dollars have also remained soft while the yen has eased back on recent revival of hopes for a trade deal between the US and China. Usually, when the dollar appreciates, buck-denominated gold falls out of favour.
- Stocks have meanwhile found renewed support since last week on US-China trade deal optimism and loose central bank policy. The S&P 500 rose for the first time in three weeks while Germany’s DAX scored its first weekly gain in 5 weeks. The rebound in stocks reduce the appeal of haven assets, which includes gold.
There are also several reasons from a technical point of view that point to weaker gold prices:
Source: Trading View and City Index
- First bearish weekly candle in 5 weeks formed at major resistance circa $1555 last week – pointing to a reversal in momentum.
- The Relative Strength Index (RSI) is in “overbought” levels of above 70 on both monthly and weekly time frames, pointing to extreme bullish exuberance – usually (but not always) a major warning that prices may reverse.
- Significant distance from the 200-day moving average (which comes in at just below $1050) suggests mean reversion likelihood increasing by the day.
Given the above considerations, I would not be surprised if gold prices broke lower from here. The next potential support comes in around $1450 on the weekly time frame, although $1504.70 is also an interesting level to watch as it marks the nearest breakout point on the daily.
Gold has risen sharply ever since bottoming out at $1160 in August 2018, with the rally gaining renewed momentum in May this year. But after a 4-month rally, the precious metal looks overbought and could be in for a correction of some sort. This won’t necessarily be a bad thing as it would reduce short-term technical overbought conditions. However, while the metal has hit key resistance in the $1555 area, it is yet to show a clear bearish reversal sign. Still, given the following considerations, I favour the downside for now:
- The Dollar Index has hit a new high on the year and is up for the 4th consecutive day. The greenback has been supported thanks mainly to weakness in European currencies with the euro, pound and franc all losing out in recent days. Commodity dollars have also remained soft while the yen has eased back on recent revival of hopes for a trade deal between the US and China. Usually, when the dollar appreciates, buck-denominated gold falls out of favour.
- Stocks have meanwhile found renewed support since last week on US-China trade deal optimism and loose central bank policy. The S&P 500 rose for the first time in three weeks while Germany’s DAX scored its first weekly gain in 5 weeks. The rebound in stocks reduce the appeal of haven assets, which includes gold.
There are also several reasons from a technical point of view that point to weaker gold prices:
Source: Trading View and FOREX.com.
- First bearish weekly candle in 5 weeks formed at major resistance circa $1555 last week – pointing to a reversal in momentum.
- The Relative Strength Index (RSI) is in “overbought” levels of above 70 on both monthly and weekly time frames, pointing to extreme bullish exuberance – usually (but not always) a major warning that prices may reverse.
- Significant distance from the 200-day moving average (which comes in at just below $1050) suggests mean reversion likelihood increasing by the day.
Given the above considerations, I would not be surprised if gold prices broke lower from here. The next potential support comes in around $1450 on the weekly time frame, although $1504.70 is also an interesting level to watch as it marks the nearest breakout point on the daily.
Related tags:




The complete CFD trading experience
Award-winning platforms, competitive spreads, low commissions and dedicated support.
We live and breathe the markets and are dedicated to helping traders realise their ambitions as we continue to set the industry bar.
Economic calendar
Web Trader platform
Our sophisticated web-based platform is packed with features.
Related articles

Gold Forecast: Are Bears Regaining Control of XAU/USD?
The start of the trading week has not been particularly favorable for gold. This can be seen in recent XAU/USD price action, with the metal falling nearly 4.00% over the last two trading sessions and bringing renewed attention to a bearish bias within the market.


Gold outlook: XAU/USD hammered, stretched and vulnerable to a sharp rebound
Gold is getting hammered for solid fundamental reasons, but history suggests extreme four-hourly oversold conditions can produce violent countertrend rallies.

Gold forecast: Rising yields become too hot for gold, but the outlook is far from bearish
Gold and silver prices took a plunge today, with the former down 3% and the latter falling some 5% by mid European session, before bouncing off their lows. The losses come after the metals remained largely supported until last week, despite the big dollar rally and surging bond yields as we have seen in recent weeks. But it simply got too much, and the metals succumbed to pressure today.

StoneX Europe Ltd may make third party material available on this website which may contain information included but not limited to the conditions of financial markets. The material is for information purposes only and does not contain, and should not be construed as containing, investment advice and/or investment recommendation and/or an investment research and/or an offer of or solicitation for any transactions in financial instruments; any decision to enter into a specific transaction shall be made by the client following an assessment by him/her of their situation.
StoneX Europe Ltd makes no representation or warranty and assumes no liability as to the accuracy or completeness of the information provided, nor any loss arising from any investment based on a recommendation, forecast or other information supplied. You should always seek independent advice as to your suitability to speculate in any related markets and your ability to assume the associated risks, if you are at all unsure. We are not under any obligation to update any such material. Any opinion made may be personal to the author and may not reflect the opinion of StoneX Europe Ltd.