





Gold forecast: XAU/USD eases after big upsurge
The metal has enjoyed an amazing run, thanks to central bank buying, strong haven demand, weakness in US dollar, inflation hedging and momentum buying, among many other fundamental reasons. But what about the gold forecast? Have we passed peak uncertainty, and is it reasonable to expect the precious metal to rise significantly further from here?
Share this:

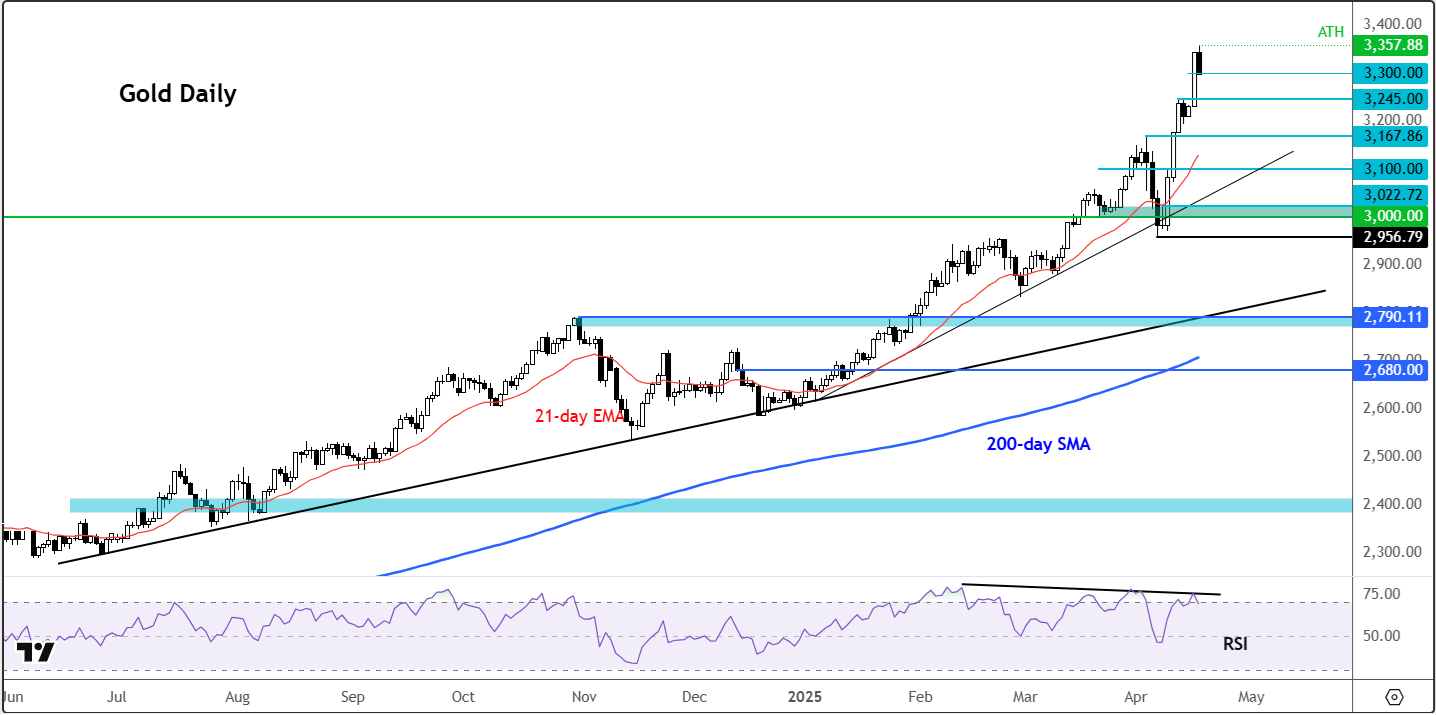
Following the big 3.5% surge to well above $3,300 mark yesterday, gold initially extended those gains to reach a new high of almost $3358 on the back of Powell’s inflation warning, before easing back down to turn lower the day. The mini reversal comes on the back of profit-taking after the metal’s big 13.5% rally from its monthly low a couple of weeks ago. That impressive $400 gain came as the stock markets have remained volatile and trade uncertainty at the forefront of investors’ minds. In other words, the sharp two-week rally to new record highs has been driven by similar forces that have been in play all this time. The metal has enjoyed an amazing run, thanks to central bank buying, strong haven demand, weakness in US dollar, inflation hedging and momentum buying, among many other fundamental reasons. But what about the gold forecast? Have we passed peak uncertainty, and is it reasonable to expect the precious metal to rise significantly further from here? Have investors overpriced the downside risks to economic and inflation outlook amid trade uncertainty? What would happen to gold if stock markets continue to regain their poise?
Gold forecast: Trade war uncertainty keeping gold bears at bay – for now
It is clear that haven demand has been one of the key factors fuelling the rally. Therefore, if the metal were to drop, it could be because to reduced haven demand. The trigger could be if the U.S. and China start trade negotiations and both sides sound optimistic about a deal. So far, it looks like we are far away from that stage with both sides ramping up tariffs and trade restrictions on another.
With China and the US getting further away from making a trade deal, this is the number one source of uncertainty right now for all sorts of risk assets. While Trump’s reversal of reciprocal tariffs on other nations is a step in the right direction, investors want to see a sign of progress with China. Until that happens, gold investors will be keen to keep doing the same: buying the dips. But at these prices, gold is looking quite expensive and could take a sharp drop once sentiment towards risk improves. So, it is all dependent on Trump’s trade war, in particular with China.
If gold tops out, it won’t go down in a straight line
With gold’s trend being so strong, any initial drop we may see could well be short lived. Just like waves and the tides in the ocean, there will be many retracements and bounces before the tide changes completely. So, whatever the trigger behind a potential drop in gold prices, don’t expect this to be a massive slide without any sharp recoveries. Those recoveries should allow traders and investors plenty of opportunities to exit their long positions, while simultaneously allow the bears ample opportunities to take advantage of the potential reversal. But we will cross that bridge if and when we get there. For now, dip-buying remains the preferred trading strategy, owning to a very strong trend and a solid fundamental backdrop.
Technical gold forecast: XAU/USD becomes even more overbought
From a technical point of view, gold is still in a strong long term bullish trend, no doubt. But with momentum gauges—particularly the RSI—screaming overbought, traders are right to raise an eyebrow. Still, these readings reflect solid buying, not weakness. So, are we nearing the top? Perhaps, but I’m not calling it just yet. Still, the RSI indicator and other oscillators serve as a warning shot for anyone blindly chasing the rally.
Gold Forecast: Is the Rally Running on Fumes?
Gold latest upsurge this wee to a new record of $3,357, dragged the daily RSI to above the 70 mark—a classic overbought signal. It doesn’t always mean an immediate drop, but a sideways move or a quick breather wouldn’t surprise, which is precisely what we have seen in the second half of today’s session.
With gold going back below the $3300 mark, the next support to watch is at $3245, formerly resistance, followed by $3,167, which also was a prior resistance level. Beneath that, $3,100 and then the crucial $3,000 zone beckon. A deeper flush could see gold revisit $2,956 or even the longer-term safety net at $2,790. But let’s not get too bearish just yet and see where gold will head to in the coming days.
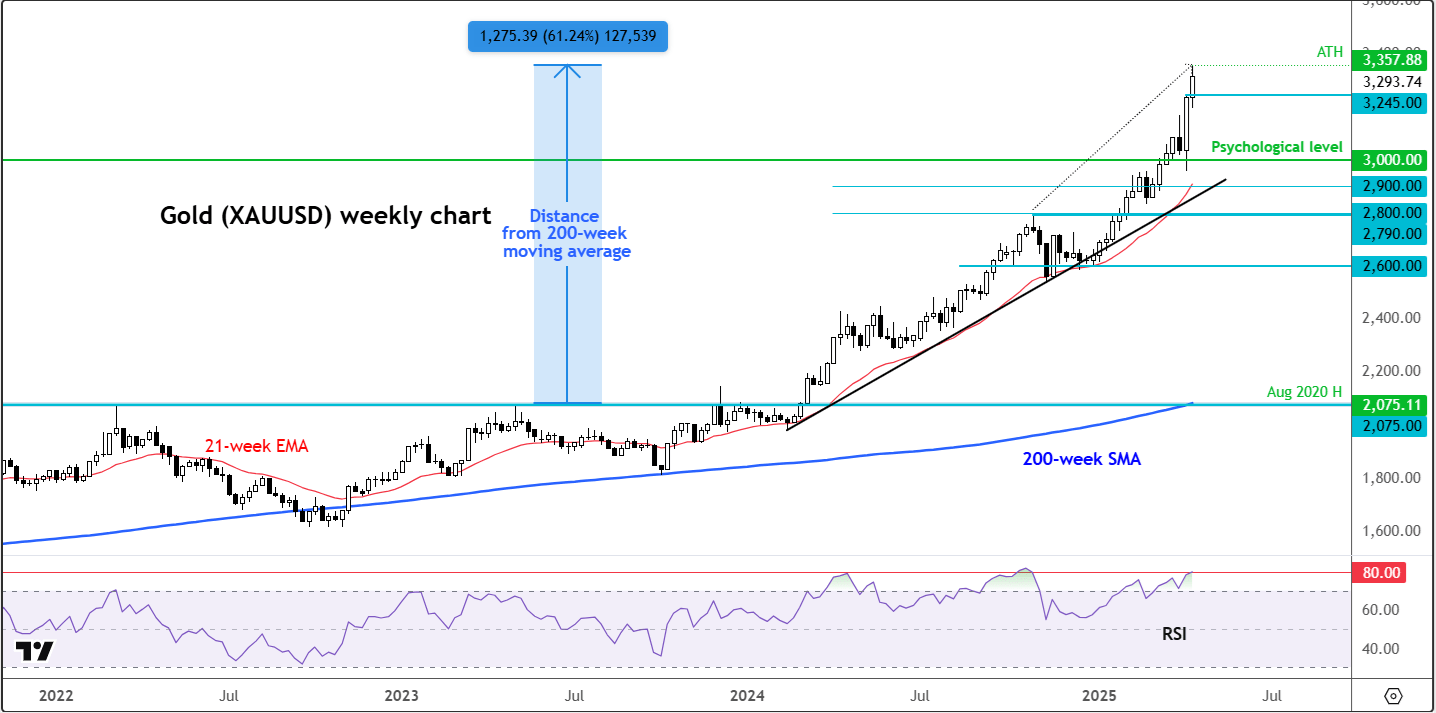
But one thing that I have been banging on about is the fact gold is getting hot, perhaps too hot for my liking. Take the monthly RSI as an example. At 85, it hasn’t looked this frothy since the pandemic highs. History tells us this often precedes lengthy consolidations—2011, 2023, and 2020 come to mind. The weekly RSI is no slouch either, hovering around 80 and showing signs of bearish divergence. It’s not a sell signal per se, but it’s definitely a flashing amber light.
Another concern? The price of gold traded a hefty $1,275 above its 200-week moving average by the tome it reached a new record high earlier in the session —a 61% premium. It’s rare to see such a wide gap sustained unless macroeconomic conditions remain strongly supportive. Yes, today’s environment may justify it, but mean reversion has a way of pulling things back in line.
Trading the Gold Forecast: When to Watch for a Reversal
So, how to play this? Trend-followers still hold the upper hand, but a reversal candle—especially on the daily or weekly chart—paired with some downside follow-through could shift the tone. Until we start seeing lower highs and lows, any dip is likely to tempt buyers, keeping the gold forecast largely bullish. But let’s be clear: this rally’s entering mature territory, and caution is warranted. And today’s mini reversal is a reminder that markets don’t always go up.
Source for all charts used in this article: TradingView.com
-- Written by Fawad Razaqzada, Market Analyst
Follow Fawad on Twitter @Trader_F_R
How to trade with City Index
You can trade with City Index by following these four easy steps:
- Open an account, or log in if you’re already a customer
• Open an account in the UK
• Open an account in Australia
• Open an account in Singapore
- Search for the company you want to trade in our award-winning platform
- Choose your position and size, and your stop and limit levels
- Place the trade
Related tags:


The complete CFD trading experience
Award-winning platforms, competitive spreads, low commissions and dedicated support.
We live and breathe the markets and are dedicated to helping traders realise their ambitions as we continue to set the industry bar.
Economic calendar
Web Trader platform
Our sophisticated web-based platform is packed with features.
Related articles

NZD/USD pressure mounts as payrolls looms large
NZD/USD has fallen sharply as Fed rate expectations reset higher, but extreme downside stretch and major support raise the risk of a violent counter-trend rebound.

US Core PCE Preview: Stale or Significant for the Fed
Core PCE inflation takes center stage Wednesday, with traders watching for signs of renewed price pressure and clues on whether the Fed could hike again in October.


Gold Forecast: Are Bears Regaining Control of XAU/USD?
The start of the trading week has not been particularly favorable for gold. This can be seen in recent XAU/USD price action, with the metal falling nearly 4.00% over the last two trading sessions and bringing renewed attention to a bearish bias within the market.

StoneX Europe Ltd may make third party material available on this website which may contain information included but not limited to the conditions of financial markets. The material is for information purposes only and does not contain, and should not be construed as containing, investment advice and/or investment recommendation and/or an investment research and/or an offer of or solicitation for any transactions in financial instruments; any decision to enter into a specific transaction shall be made by the client following an assessment by him/her of their situation.
StoneX Europe Ltd makes no representation or warranty and assumes no liability as to the accuracy or completeness of the information provided, nor any loss arising from any investment based on a recommendation, forecast or other information supplied. You should always seek independent advice as to your suitability to speculate in any related markets and your ability to assume the associated risks, if you are at all unsure. We are not under any obligation to update any such material. Any opinion made may be personal to the author and may not reflect the opinion of StoneX Europe Ltd.