




Gold, Silver Forecast: Bullish Triangle Breakout?
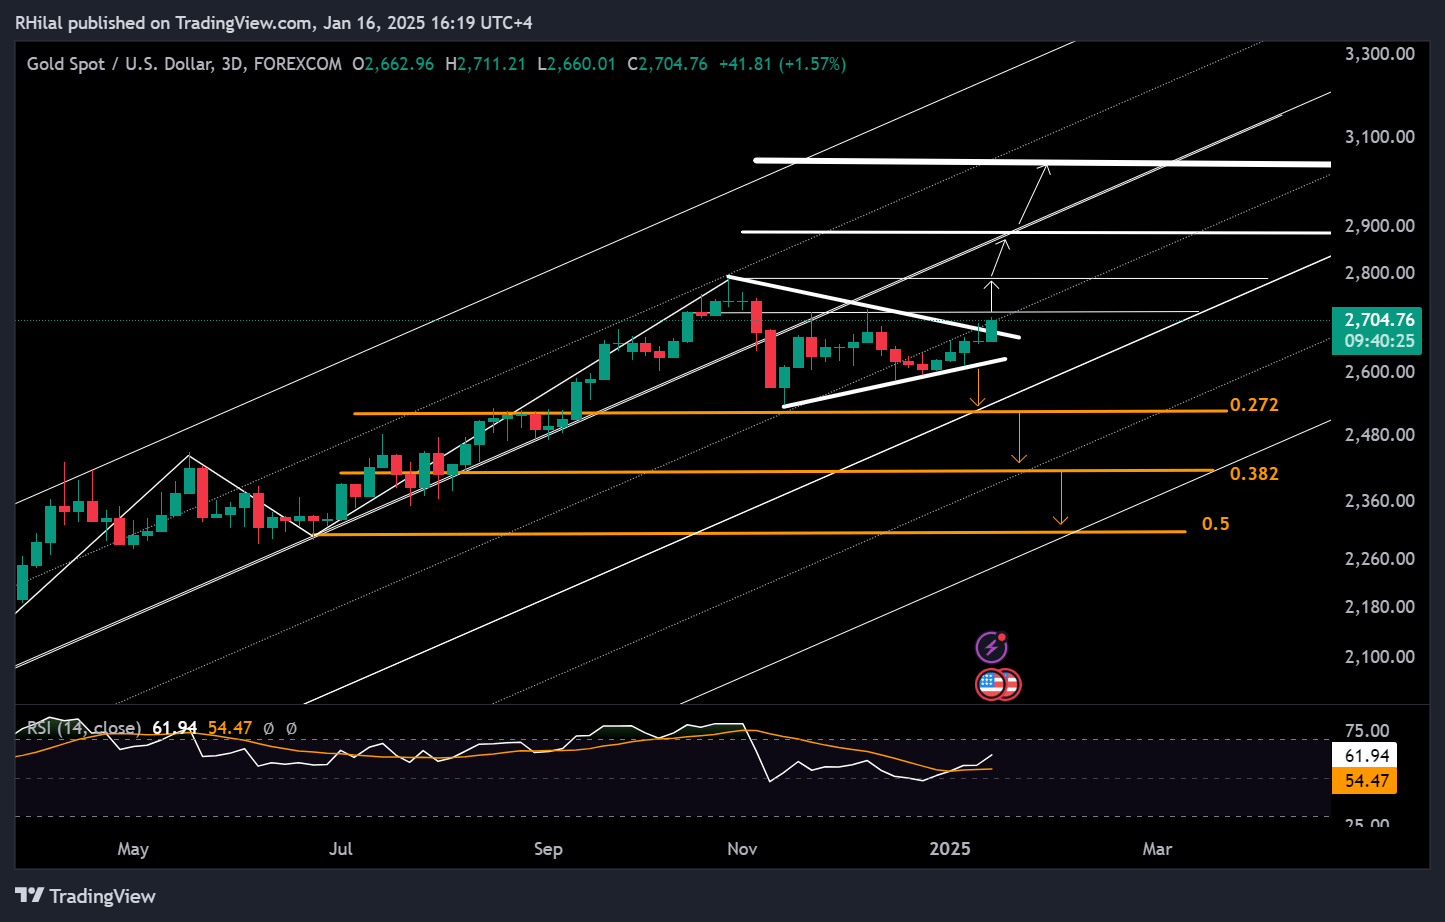
Gold, Silver Forecast: Following the triangle formation in gold prices between December 2024 and January 2025, gold has taken a bullish turn, breaking above the $2,700 mark and eyeing its all-time high once again.
Share this:

Article Outline
- Key Events: Chinese Metrics, Geopolitics, and Inflation
- Technical Analysis: XAUUSD, XAGUSD (3-Day Time Frames)
- Technical Analysis (TA) Tip: Noise Reduction
Intro
Gold’s extended triangle consolidation and silver’s repeated rebounds at critical support levels have signaled bullish trends on the charts. These bullish grounds are driven by inflation concerns, geopolitical uncertainties, and advancements in China’s economic data.
Chinese Economy Update
China’s latest economic data has supported gold’s upward trajectory, emphasizing the positive correlation between China’s growth and gold purchases:
• New Loans: Increased from 580B to 990B, reaching a 3-month high
• Trade Balance: Surged to a 10-month high with a surplus of 753B
However, much of the positive export data is attributed to a frontload of shipments ahead of anticipated U.S. tariffs under Trump’s administration. This geopolitical backdrop, coupled with trade war risks, has bolstered gold’s safe-haven appeal.
Key Chinese metrics to watch this week include GDP, industrial production, retail sales, and FDI reports, all scheduled for Friday. These indicators will offer further insight into China’s economic strength and its impact on commodity demand.
US Inflation and Global Currency Risks
Positive non-farm payroll results have intensified inflation concerns and US CPI data delivered mixed signals, pushing the DXY to mark a resistance at the 110 mark and pressure global currencies to critical lows. Gold remains on an upward trajectory, benefiting from its inflation-hedging properties, until key support levels are breached.
Technical Analysis: Quantifying Uncertainties
Gold Forecast: 3-Day Time Frame – Log Scale
Source: Tradingview
Gold’s extended triangle formation, spanning December 2024 to January 2025 within the $2,500 to $2,700 price zones, has broken positively above $2,700. This move aligns with a rebounding 3-day Relative Strength Index (RSI) from neutral levels and above its moving average.
Key Levels to Watch
Upside: $2,730 and $2,800 are the next resistance levels in line, with extended bullish scenarios aiming for $2,890 and $3,050
Downside: The upper boundary of the triangle, now at $2,680–$2,660, serves as potential support and a key reversal zone
Further declines could test support levels at $2,580 and $2,520 before signaling a deeper bearish scenario.
Silver Forecast: 3 Day Time Frame – Log Scale
Source: Tradingview
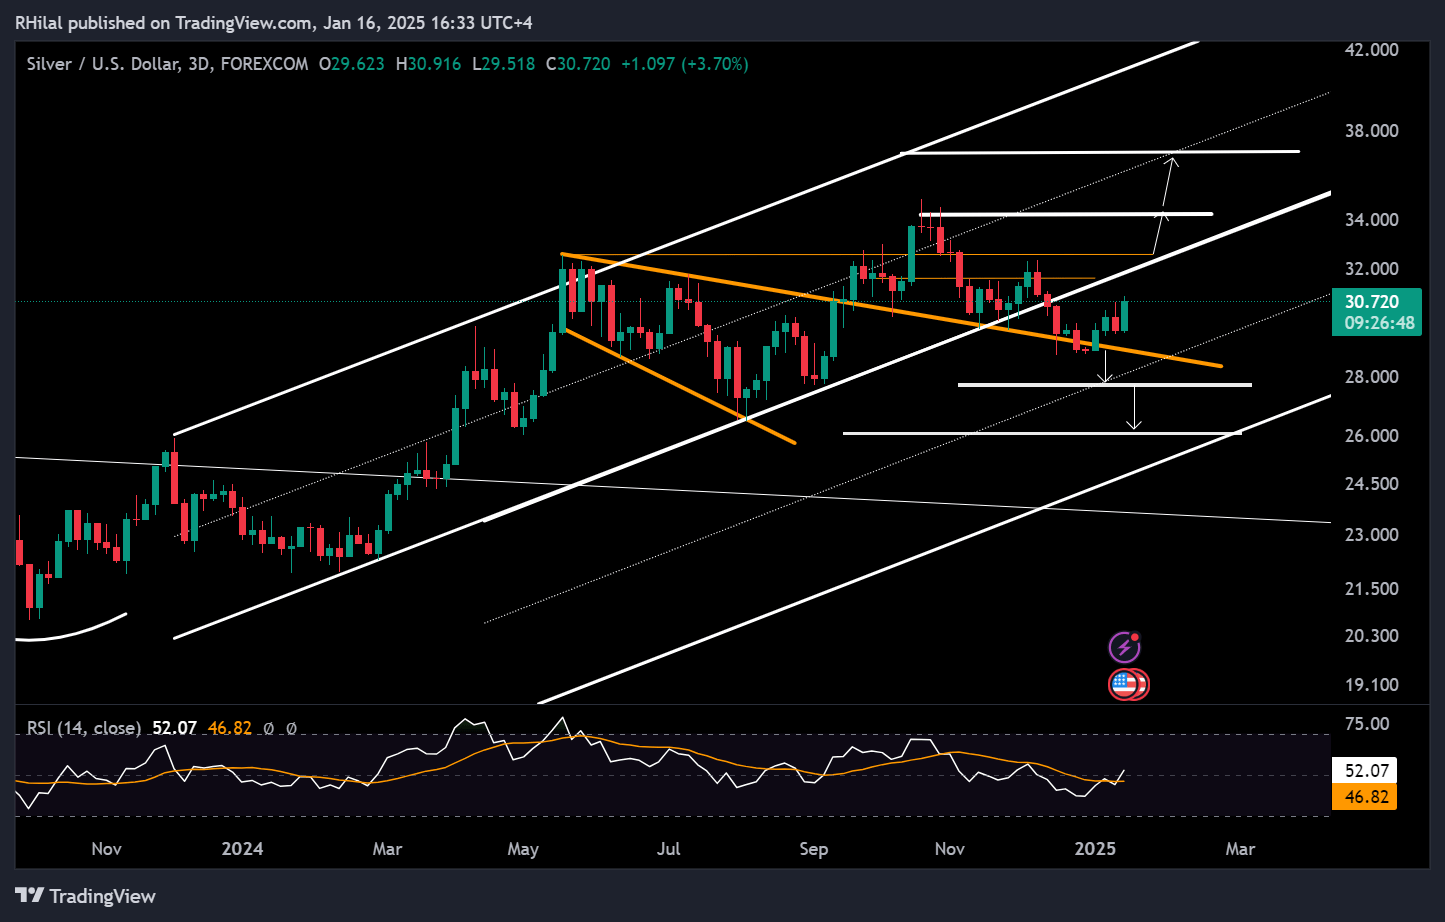
Silver recently slipped below the $30 mark and the boundaries of its year-long primary uptrending parallel channel. However, it held support at the trendline connecting highs and lows from May 2024 to January 2025.
Key Levels to Watch
• Upside: A confirmed uptrend requires moves toward $31.60 and $32.60, with extended bullish scenarios targeting $37 and $40.
• Downside: A close below $28.70 could extend bearish scenarios to $27.70, with critical support at $26.
Technical Analysis (TA) Tip: Noise Reduction
Reducing chart noise is essential for identifying reliable patterns. Using 3-day time frames helps minimize noise, providing a clearer perspective on trends and their respective rebounds. The higher the time frame, the simpler and more comprehensible the chart becomes, allowing for better trend analysis and decision-making.
Written by Razan Hilal, CMT
Follow on X: @Rh_waves
On You tube: Forex.com




The complete CFD trading experience
Award-winning platforms, competitive spreads, low commissions and dedicated support.
We live and breathe the markets and are dedicated to helping traders realise their ambitions as we continue to set the industry bar.
Economic calendar
Web Trader platform
Our sophisticated web-based platform is packed with features.
Related articles

Gold Forecast: Are Bears Regaining Control of XAU/USD?
The start of the trading week has not been particularly favorable for gold. This can be seen in recent XAU/USD price action, with the metal falling nearly 4.00% over the last two trading sessions and bringing renewed attention to a bearish bias within the market.


Gold outlook: XAU/USD hammered, stretched and vulnerable to a sharp rebound
Gold is getting hammered for solid fundamental reasons, but history suggests extreme four-hourly oversold conditions can produce violent countertrend rallies.


Gold forecast: Rising yields become too hot for gold, but the outlook is far from bearish
Gold and silver prices took a plunge today, with the former down 3% and the latter falling some 5% by mid European session, before bouncing off their lows. The losses come after the metals remained largely supported until last week, despite the big dollar rally and surging bond yields as we have seen in recent weeks. But it simply got too much, and the metals succumbed to pressure today.

StoneX Europe Ltd may make third party material available on this website which may contain information included but not limited to the conditions of financial markets. The material is for information purposes only and does not contain, and should not be construed as containing, investment advice and/or investment recommendation and/or an investment research and/or an offer of or solicitation for any transactions in financial instruments; any decision to enter into a specific transaction shall be made by the client following an assessment by him/her of their situation.
StoneX Europe Ltd makes no representation or warranty and assumes no liability as to the accuracy or completeness of the information provided, nor any loss arising from any investment based on a recommendation, forecast or other information supplied. You should always seek independent advice as to your suitability to speculate in any related markets and your ability to assume the associated risks, if you are at all unsure. We are not under any obligation to update any such material. Any opinion made may be personal to the author and may not reflect the opinion of StoneX Europe Ltd.