



Hang Seng Tech Index: Bulls pause with Alibaba, Nvidia in focus
The Hang Seng Tech Index has lost momentum after leading the China rally this year, with Alibaba and Nvidia earnings set to provide the next big test for directional risk.
Share this:

Summary
The Hang Seng Tech Index has stalled having led the China equity rally throughout this year, showing rare signs of caution ahead of a busy period for earnings. Alibaba reports Thursday with the focus again on its AI strategy, though like Tencent and Baidu, big investments have yet to deliver with revenues squeezed by weak consumer uptake and fierce price competition. With Nvidia earnings due after the bell on Wednesday, how the index trades around these key updates may provide a guide on directional risks for the broader Hang Seng and other Chinese markets heading into September.
Hang Seng Tech Rally Pauses as Key Earnings Near
Source: TradingView
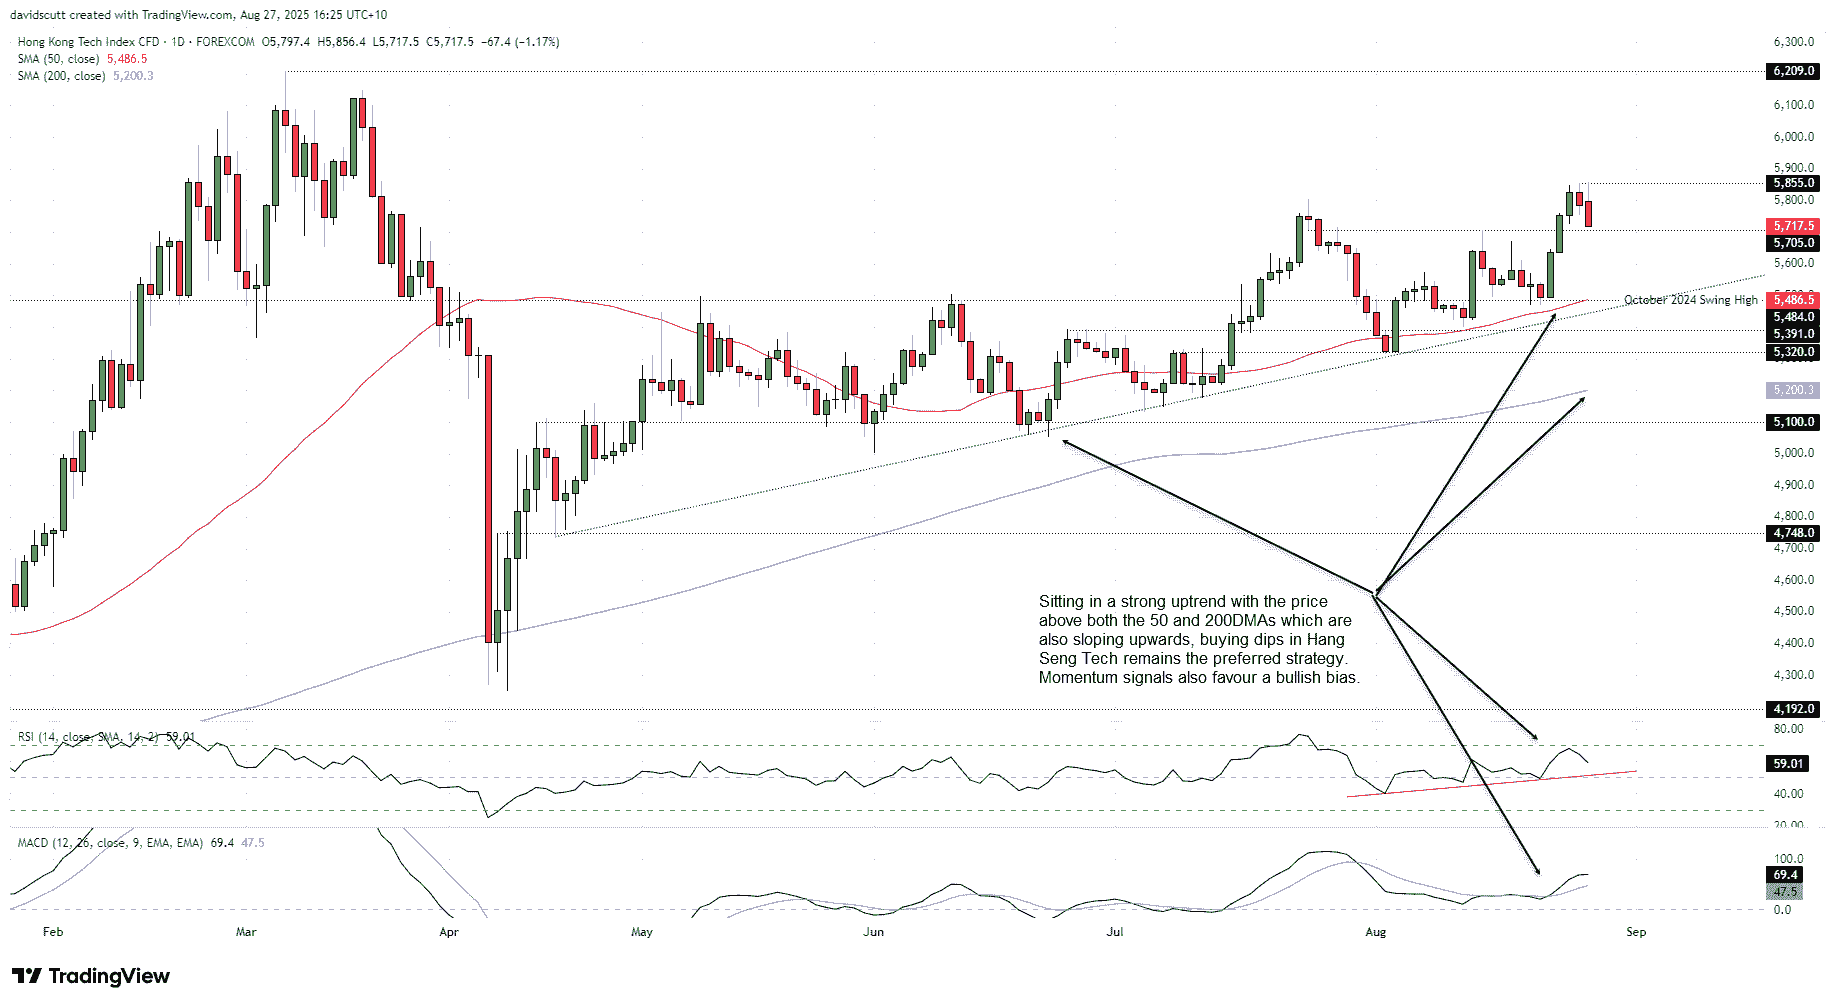
You can see how the sharp rebound in the Hang Seng Tech Index following Jerome Powell’s speech at the Jackson Hole has stalled this week, with the contract struggling to hold above the July 24 swing high, topping out at 5855 before reversing lower. Given the unconvincing price action, it’s worthwhile taking a look at key levels located nearby, allowing traders to assess potential setups before and after this period of major corporate event risk hits.
On the downside, 5705 provided both support and resistance over the past two months, making it the first level of note. Beyond that, the October 2024 swing high of 5484 saw plenty of action earlier in the year. Combined with the uptrend running from the low set on April 16 and 50-day moving average, this support zone that extends down to 5440 could prove difficult to crack without a major risk-off episode. If it were to be broken, 5391, 5320, the 200-day moving average and 5100 are the levels to watch.
On the topside, a clean break above 5855 would put the March swing high of 6209 on the radar for bulls, with only the psychological 6000-point level in between.
Given the index remains in an uptrend and comfortably above the 50 and 200-day moving averages, which are also moving higher, buying dips and bullish breaks remains the preferred strategy. Momentum indicators back this view, with RSI (14) trending higher above 50 while MACD sits in positive territory having already crossed the signal line from below earlier this month. Combined, a bullish directional bias is favoured.
Related tags:
Latest market news



The complete CFD trading experience
Award-winning platforms, competitive spreads, low commissions and dedicated support.
We live and breathe the markets and are dedicated to helping traders realise their ambitions as we continue to set the industry bar.
Economic calendar
Web Trader platform
Our sophisticated web-based platform is packed with features.
Related articles
EUR/USD weekly outlook: Oil, inflation and NFP in focus
After coming under significant pressure in recent weeks, the EUR/USD came off its lows to finish the week on a positive note on Friday, albeit with only a mild rebound. That was not enough to prevent the exchange rate falling for the third consecutive week, as the US dollar and bond yields rallied across the board.
Gold Q4 2026 outlook: Resilience in the face of rallying dollar and yields
As we headed towards the latter stages of Q3 and into Q4, the Fed had just hiked rates in a hawkish FOMC meeting, while the likes of the ECB and BoJ had also tightened their respective policies. Oil prices remained elevated amid the prolonged US-Iran conflict. Meanwhile, bond yields were breaking out, and the dollar was higher across the board. Yet, remarkably, gold was still holding in the positive territory for the third quarter, even if it had weakened somewhat in September.

Oil Quietly Hands the Fed a Reason to Stay Hawkish
Oil prices and the U.S. dollar are both on the front foot as elevated energy costs feed Fed warnings that inflation may prove sticky.
StoneX Europe Ltd may make third party material available on this website which may contain information included but not limited to the conditions of financial markets. The material is for information purposes only and does not contain, and should not be construed as containing, investment advice and/or investment recommendation and/or an investment research and/or an offer of or solicitation for any transactions in financial instruments; any decision to enter into a specific transaction shall be made by the client following an assessment by him/her of their situation.
StoneX Europe Ltd makes no representation or warranty and assumes no liability as to the accuracy or completeness of the information provided, nor any loss arising from any investment based on a recommendation, forecast or other information supplied. You should always seek independent advice as to your suitability to speculate in any related markets and your ability to assume the associated risks, if you are at all unsure. We are not under any obligation to update any such material. Any opinion made may be personal to the author and may not reflect the opinion of StoneX Europe Ltd.