







Happy 5 Year Anniversary to SNB Peg Removal
EUR/CHF fell from the floor of 1.2000 down to a low near .9650 in a heartbeat
Share this:

As soon as China was removed from the list of currency manipulators earlier this week, Switzerland was added. Strength in EUR/CHF has always been a big problem for the SNB. Recall exactly 5 years ago today, January 15th, 2015, when the Swiss National Bank (SNB) removed the Swiss Franc peg to the Euro and allowed the Franc to float. EUR/CHF fell from the floor of 1.2000 down to a low near .9650 in a heartbeat, taking out longs who believed the SNB would commit to the 1.2000 floor. Traders, and a few brokers, were wiped out of business on that day as they didn’t have the funds to pay their margin calls. Liquidity was extremely scarce, and even if you did have a stop in place, most weren’t filled until well below their stop levels.
Source: Tradingview, City Index
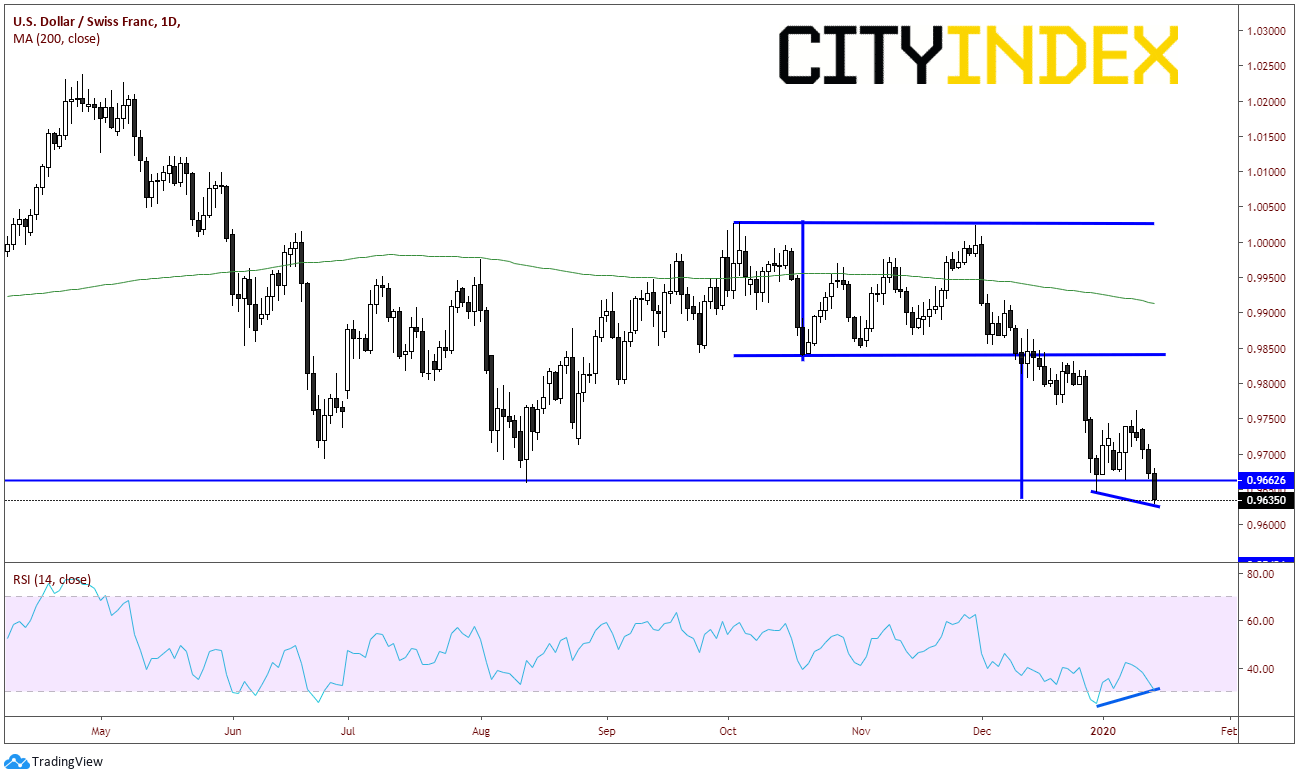
The SNB still admittedly intervenes in the market to help lower the value of the Swiss Franc, so being labeled a currency manipulator should not be much of a surprise. However, as of the beginning of December, it doesn’t appear as though they have been involved too much in USD/CHF. From early October 2019 until early December 2019, USD/CHF was stuck in a range between .9850 and 1.0025. Twice the pair tried to clear the 1.000 level, only to close back below it. This set up a double top on a daily time frame. On December 10th, USD/CHF finally broke below the neckline of the double top, setting up a target equal to the width of the double top added to the breakdown point, which is .9635. Today, price is closing right near that level, reaching the double top target. USD/CHF closed today at its lowest level since August 13th, 2019. Price is also diverging with the RSI, indicating a possible near-term reversal.
Source: Tradingview, City Index
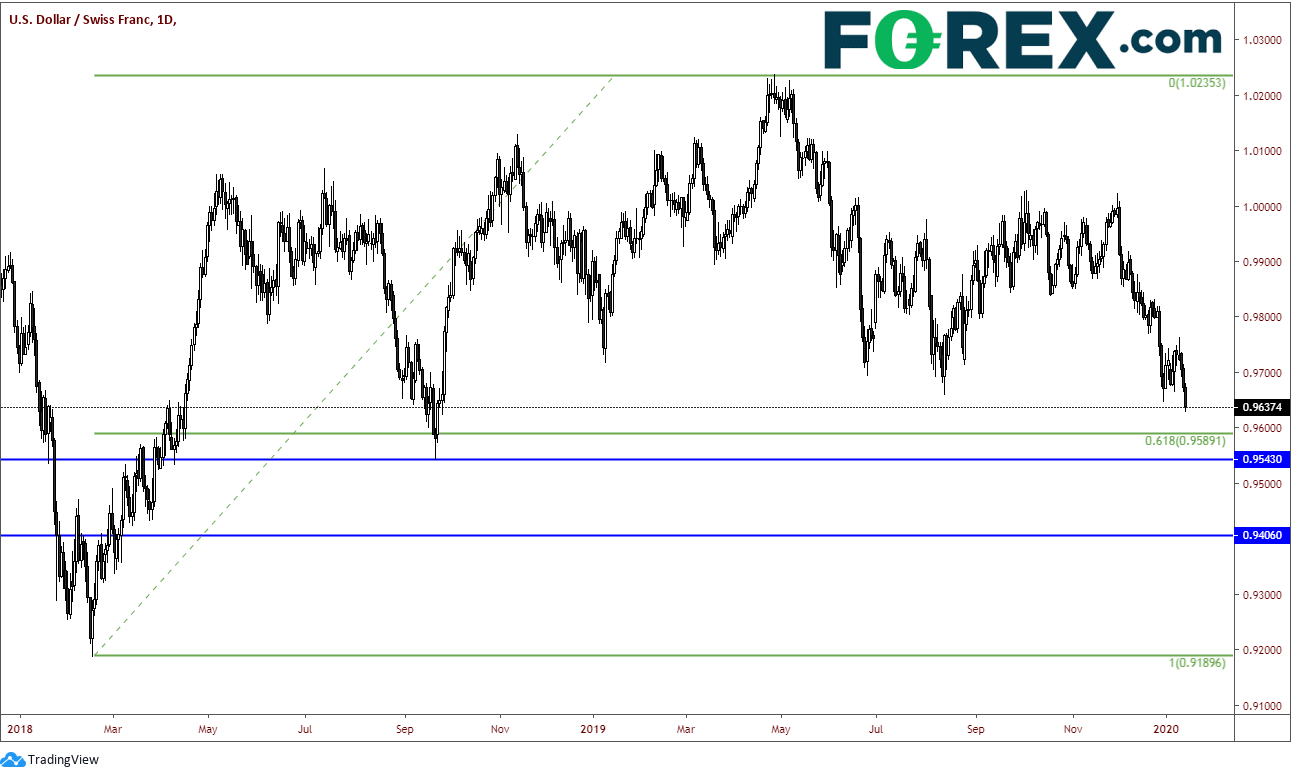
If price does continue to move lower, first support is near .9590, which is the 61.8% Fibonacci Retracement level from the lows of February 16th, 2018 to the highs of April 26th, 2019. Next support is previous lows, which come across near .9543 and then some minor horizontal support all the way down near .9400.
Source: Tradingview, City Index
On a 240-minute timeframe, note that the RSI has moved into oversold territory and is diverging from price as well. Resistance above comes across near .9715, which is the intersection of horizontal resistance and a downward sloping trendline going back to early December 2019. Above that, there is horizontal resistance near .9770 and then resistance at the breakdown level from the double top near .9850.
Source: Tradingview, City Index
Over the last 2 days, both EUR/CHF and USD/CHF have made new long-term lows. One of the reasons for this could be that the SNB has intervened less. However, one should never forget the lesson the markets learned 5 years ago today….that they could be much lower and much more quickly!
As soon as China was removed from the list of currency manipulators earlier this week, Switzerland was added. Strength in EUR/CHF has always been a big problem for the SNB. Recall exactly 5 years ago today, January 15th, 2015, when the Swiss National Bank (SNB) removed the Swiss Franc peg to the Euro and allowed the Franc to float. EUR/CHF fell from the floor of 1.2000 down to a low near .9650 in a heartbeat, taking out longs who believed the SNB would commit to the 1.2000 floor. Traders, and a few brokers, were wiped out of business on that day as they didn’t have the funds to pay their margin calls. Liquidity was extremely scarce, and even if you did have a stop in place, most weren’t filled until well below their stop levels.
Source: Tradingview, FOREX.com
The SNB still admittedly intervenes in the market to help lower the value of the Swiss Franc, so being labeled a currency manipulator should not be much of a surprise. However, as of the beginning of December, it doesn’t appear as though they have been involved too much in USD/CHF. From early October 2019 until early December 2019, USD/CHF was stuck in a range between .9850 and 1.0025. Twice the pair tried to clear the 1.000 level, only to close back below it. This set up a double top on a daily timeframe. On December 10th, USD/CHF finally broke below the neckline of the double top, setting up a target equal to the width of the double top added to the breakdown point, which is .9635. Today, price is closing right near that level, reaching the double top target. USD/CHF closed today at its lowest level since August 13th, 2019. Price is also diverging with the RSI, indicating a possible near-term reversal.
Source: Tradingview, FOREX.com
If price does continue to move lower, first support is near .9590, which is the 61.8% Fibonacci Retracement level from the lows of February 16th, 2018 to the highs of April 26th, 2019. Next support is previous lows, which come across near .9543 and then some minor horizontal support all the way down near .9400.
Source: Tradingview, FOREX.com
On a 240-minute timeframe, note that the RSI has moved into oversold territory and is diverging from price as well. Resistance above comes across near .9715, which is the intersection of horizonal resistance and a downward sloping trendline going back to early December 2019. Above that, there is horizontal resistance near .9770 and then resistance at the breakdown level from the double top near .9850.
Source: Tradingview, FOREX.com
Over the last 2 days, both EUR/CHF and USD/CHF have made new long-term lows. One of the reasons for this could be that the SNB has intervened less. However, one should never forget the lesson the markets learned 5 years ago today….that they could be much lower and much more quickly!
Related tags:

The complete CFD trading experience
Award-winning platforms, competitive spreads, low commissions and dedicated support.
We live and breathe the markets and are dedicated to helping traders realise their ambitions as we continue to set the industry bar.
Economic calendar
Web Trader platform
Our sophisticated web-based platform is packed with features.
Related articles

USD into a Massive Week as Yields Fly and Gold Breaks
It’s a huge week with PCE and NFP, but it’s what’s happening off of the calendar that demands attention with US yields flying to fresh multi-decade highs.


USDJPY Forecast Intervention Fears Clash with Dollar Strength
Recent trading sessions have produced mixed results for the Japanese yen. By the end of last week, USD/JPY had fallen by more than 1.00%, reflecting a modest recovery in the yen. However, the start of this week has seen the pair move slightly back in favor of the U.S. dollar, posting gains of around 0.04%.


AUD/USD forecast: Currency Pair of the Week | September 28, 2026
The week has started with stocks, gold, silver and bitcoin all falling, as crude oil rebounded and bond yields pushed further higher. Trump refusing to agree to Tehran’s proposal to re-open the Strait of Hormuz has left the markets disappointed. Still, reports that mediators are expected to hold talks with the two sides on an amended version of the 7-day proposal that Iran presented, keeps hopes alive that we may see some progress.
StoneX Europe Ltd may make third party material available on this website which may contain information included but not limited to the conditions of financial markets. The material is for information purposes only and does not contain, and should not be construed as containing, investment advice and/or investment recommendation and/or an investment research and/or an offer of or solicitation for any transactions in financial instruments; any decision to enter into a specific transaction shall be made by the client following an assessment by him/her of their situation.
StoneX Europe Ltd makes no representation or warranty and assumes no liability as to the accuracy or completeness of the information provided, nor any loss arising from any investment based on a recommendation, forecast or other information supplied. You should always seek independent advice as to your suitability to speculate in any related markets and your ability to assume the associated risks, if you are at all unsure. We are not under any obligation to update any such material. Any opinion made may be personal to the author and may not reflect the opinion of StoneX Europe Ltd.