



Has USDJPY printed a blow off high or building for another leg higher?
Positive developments overnight as both Moscow and Kyiv reported peace talks in Istanbul have been productive and after Russia claimed it would pare back activities in Kyiv and Chernihiv.
Share this:

Positive developments overnight as both Moscow and Kyiv reported peace talks in Istanbul have been productive and after Russia claimed it would pare back activities in Kyiv and Chernihiv.
As the market waits for more evidence of a lasting ceasefire, attention will be on the March 31st Fiscal year-end in Japan. More so after USDJPYs near-vertical rally in March.
Over the past 48 hours, USDJPY has pulled back from above 125.00 to near 122.00. The pullback on a mix of profit-taking, rebalancing flows for Japanese fiscal year-end, a retracement lower in U.S yields and after comments from a Japan MoF official who noted “sudden volatility in FX markets isn’t desirable.”
While more of this jawboning from Japanese officials is likely, it will likely only dampen the speed of USDJPY’s ascent rather than reverse its direction.
This is because the driver of USDJPY will continue to be the monetary policy divergence between a hawkish Federal Reserve contrasted with a dovish Bank of Japan. It is amplified by Japan’s need to buy USD’s to pay for energy imports.
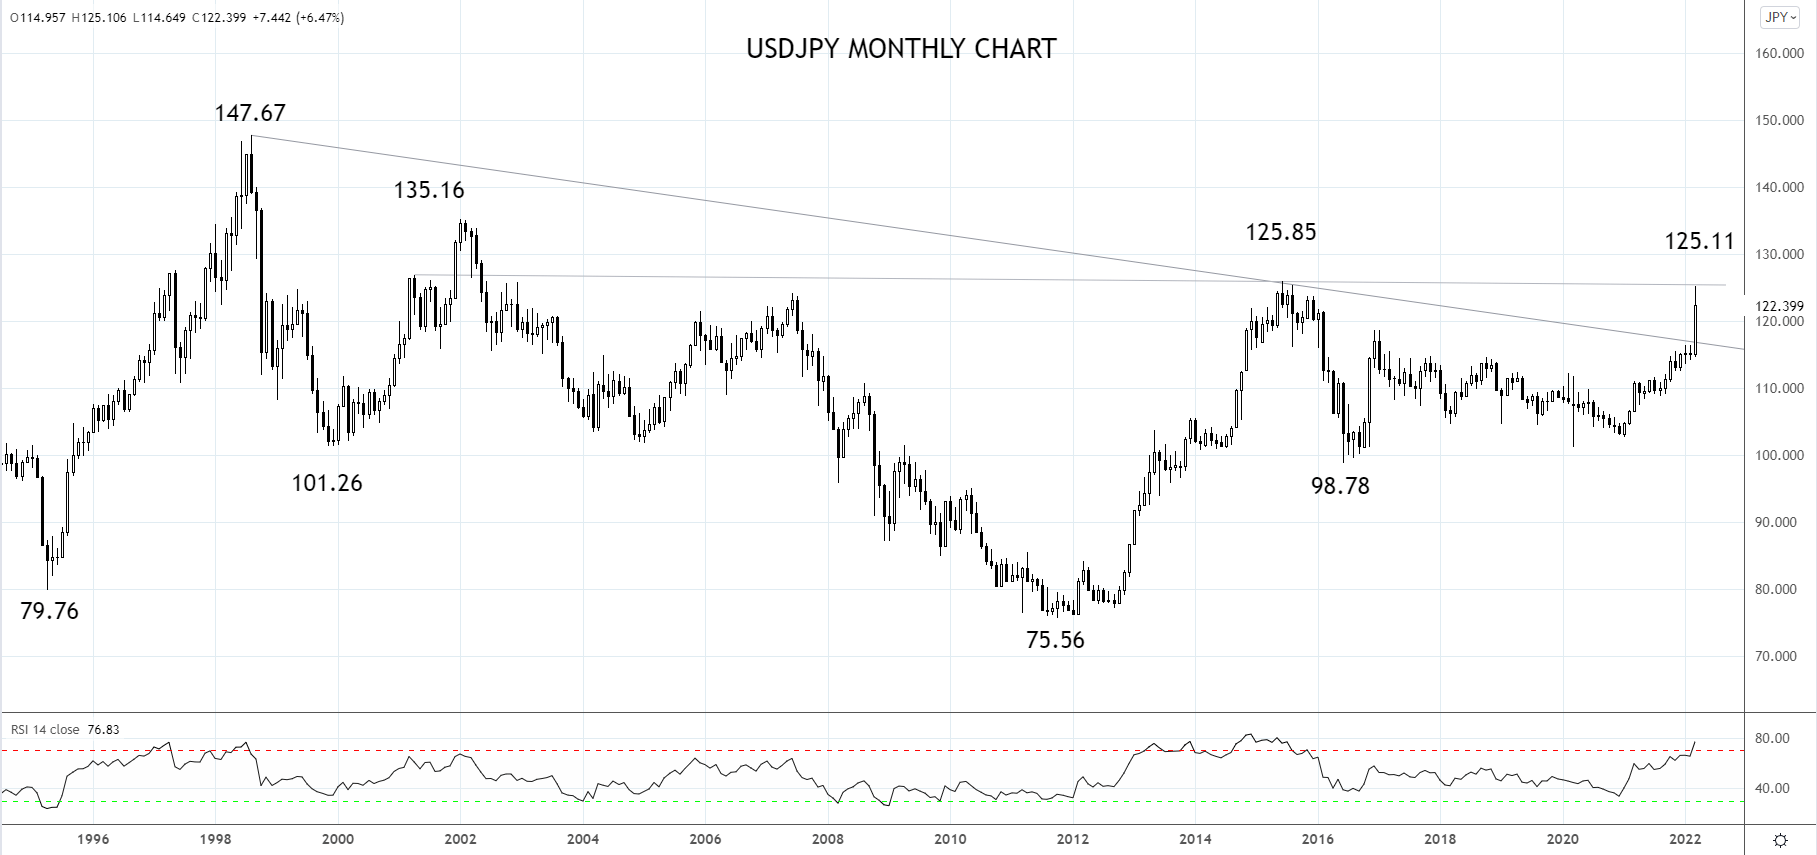
The chart below is a monthly chart of USDJPY going back to 1995, useful in gauging whether this month’s explosive rally has been a blow-off type high or the next stage of an impulsive rally higher.
After breaking above downtrend resistance at 117.00ish from the 1998 August, 147.67 high USJPY stalled this week ahead of a 20-year layer of horizontal resistance between 126 and 127.
Should USDJPY register a sustained break above 126/127, it would signal the next leg higher in USDJPY is underway, towards the 135.16 high of 2002 with scope to the 147.67 high of 1998. Until then, dips back towards 120.00 should be well supported.
Source Tradingview. The figures stated are as of Mar 30, 2022. Past performance is not a reliable indicator of future performance. This report does not contain and is not to be taken as containing any financial product advice or financial product recommendation
How to trade with City Index
You can trade with City Index by following these four easy steps:
- Open an account, or log in if you’re already a customer
• Open an account in the UK
• Open an account in Australia
• Open an account in Singapore
- Search for the company you want to trade in our award-winning platform
- Choose your position and size, and your stop and limit levels
- Place the trade
A
s the market waits for more evidence of a lasting ceasefire, attention will be on the March 31st Fiscal year-end in Japan. More so after USDJPYs near-vertical rally in March.
Over the past 48 hours, USDJPY has pulled back from above 125.00 to near 122.00. The pullback on a mix of profit-taking, rebalancing flows for Japanese fiscal year-end, a retracement lower in U.S yields and after comments from a Japan MoF official who noted “sudden volatility in FX markets isn’t desirable.”
While more of this jawboning from Japanese officials is likely, it will likely only dampen the speed of USDJPY’s ascent rather than reverse its direction.
This is because the driver of USDJPY will continue to be the monetary policy divergence between a hawkish Federal Reserve contrasted with a dovish Bank of Japan. It is amplified by Japan’s need to buy USD’s to pay for energy imports.
The chart below is a monthly chart of USDJPY going back to 1995, useful in gauging whether this month’s explosive rally has been a blow-off type high or the next stage of an impulsive rally higher.
After breaking above downtrend resistance at 117.00ish from the 1998 August, 147.67 high USJPY stalled this week ahead of a 20-year layer of horizontal resistance between 126 and 127.
Should USDJPY register a sustained break above 126/127, it would signal the next leg higher in USDJPY is underway, towards the 135.16 high of 2002 with scope to the 147.67 high of 1998. Until then, dips back towards 120.00 should be well supported.
SourceTradingview.ThefiguresstatedareasofMar 30,2022.Pastperformanceisnotareliableindicatoroffutureperformance.Thisreportdoesnotcontain and is not to be taken as containing any financial product advice or financial product recommendation
Related tags:
Latest market news




The complete CFD trading experience
Award-winning platforms, competitive spreads, low commissions and dedicated support.
We live and breathe the markets and are dedicated to helping traders realise their ambitions as we continue to set the industry bar.
Economic calendar
Web Trader platform
Our sophisticated web-based platform is packed with features.
Related articles
USD/JPY Q4 2026 Outlook: Hawkish Fed Pricing Clashes With Intervention Risk
The year-end tug-of-war is clear: hawkish Fed pricing supports USD/JPY, while intervention risk limits the upside.
Japanese Yen Forecast: USD/JPY 4% Rally Challenges Post-Intervention Downtrend 9 24 2026
USD/JPY momentum has shifted sharply higher, putting a major resistance confluence in focus as U.S. and Japanese event risk builds.


Oil Quietly Hands the Fed a Reason to Stay Hawkish
Oil prices and the U.S. dollar are both on the front foot as elevated energy costs feed Fed warnings that inflation may prove sticky.

StoneX Europe Ltd may make third party material available on this website which may contain information included but not limited to the conditions of financial markets. The material is for information purposes only and does not contain, and should not be construed as containing, investment advice and/or investment recommendation and/or an investment research and/or an offer of or solicitation for any transactions in financial instruments; any decision to enter into a specific transaction shall be made by the client following an assessment by him/her of their situation.
StoneX Europe Ltd makes no representation or warranty and assumes no liability as to the accuracy or completeness of the information provided, nor any loss arising from any investment based on a recommendation, forecast or other information supplied. You should always seek independent advice as to your suitability to speculate in any related markets and your ability to assume the associated risks, if you are at all unsure. We are not under any obligation to update any such material. Any opinion made may be personal to the author and may not reflect the opinion of StoneX Europe Ltd.