



How has the SP500 pushed through 3000
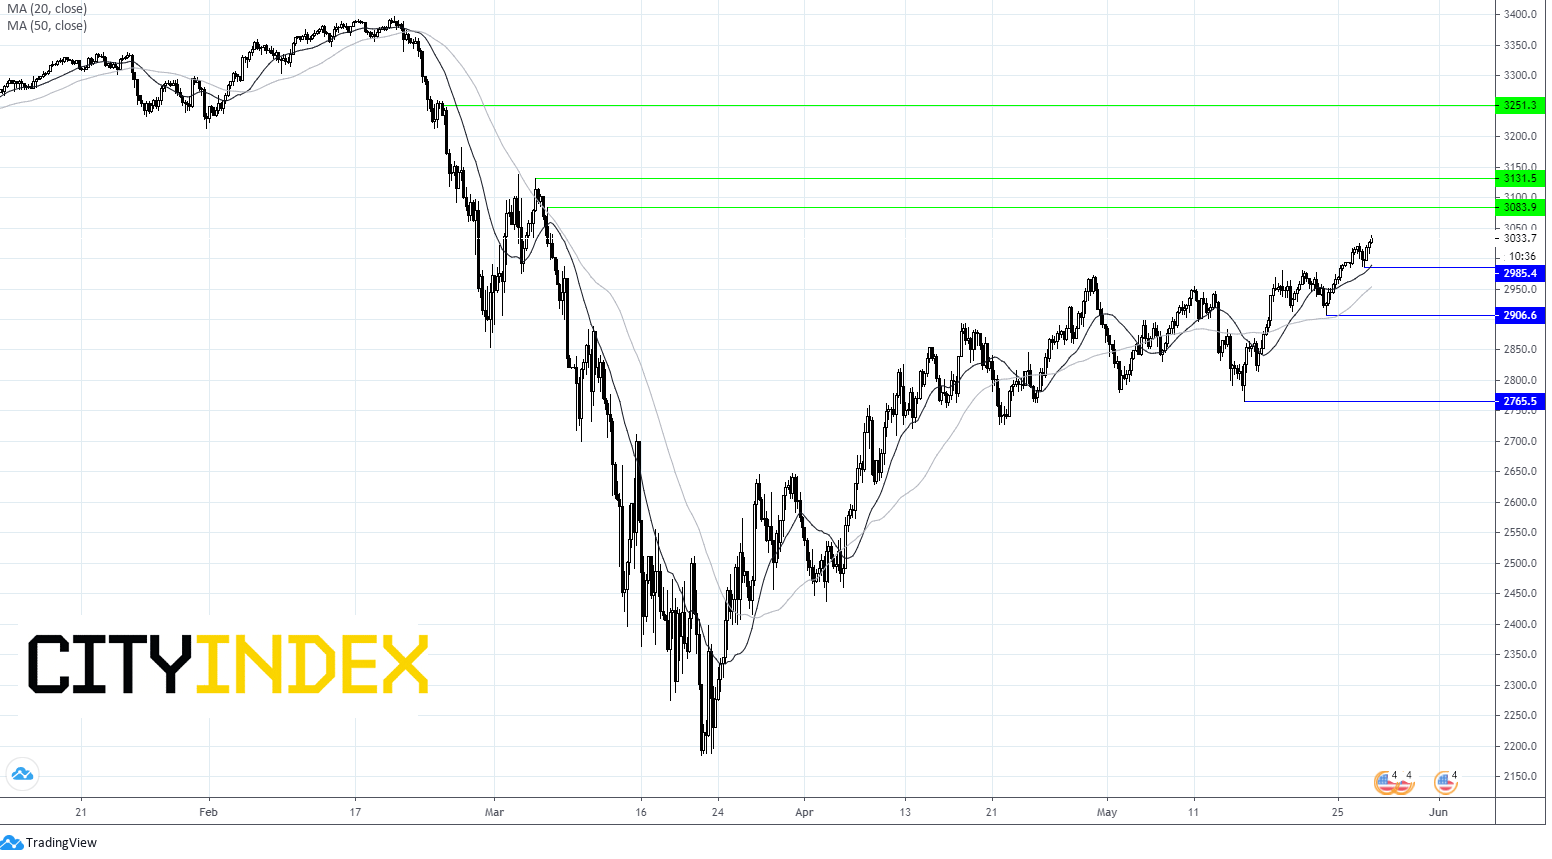
S&P 500 is trading comfortably over the key psychological 3000 mark, a 37% rally from the mid -March low, a turnaround that seemed impossible just two months earlier.
Share this:

The S&P closed up 1.2% in the previous session at 2991 after hitting a high of 3021. S&P futures are pointing to a jump on the open, taking the US index comfortably over the key psychological 3000 mark.
This represents a 37% rally from the mid -March low, a turnaround that seemed impossible just two months earlier.
Dire data
The rally is clearly not based on economic data, which continues to print a horror show. Almost 25% of the US working population has signed up for unemployment benefits, manufacturing and service sector activity remains deep in contraction, retail sales are at a record low and consumer sentiment is only very gradually lifting. The recovery in the market is well ahead of any economic recovery seen in macro data.
The rally is clearly not based on economic data, which continues to print a horror show. Almost 25% of the US working population has signed up for unemployment benefits, manufacturing and service sector activity remains deep in contraction, retail sales are at a record low and consumer sentiment is only very gradually lifting. The recovery in the market is well ahead of any economic recovery seen in macro data.
Stimulus high
Instead the rally has been fuelled by extraordinary stimulus measures by the US Federal Reserve and other central banks across the globe, in addition to a $2 trillion rescue package from Congress and growing optimism of a covid-19 vaccine.
Instead the rally has been fuelled by extraordinary stimulus measures by the US Federal Reserve and other central banks across the globe, in addition to a $2 trillion rescue package from Congress and growing optimism of a covid-19 vaccine.
Vaccine hopes
Inovio is the latest company to inform the market of progress in its vaccine development. The update comes hot on the heels of encouraging updates from Novavax, Modern and Oxford University to name a few.
Inovio is the latest company to inform the market of progress in its vaccine development. The update comes hot on the heels of encouraging updates from Novavax, Modern and Oxford University to name a few.
Yet given the dire economic backdrop, there is an overriding sense that the markets are overly optimistic and the march higher can’t continue at this pace. Any vaccine is not realistically expected until Q1 next year at the earliest.
Tech giants rally
The push high is also being driven by a rally in a handful of tech giants Facebook, Amazon, Microsoft, Apple and Google parent Alphabet. These tech giants make up around 20% of the weight of the S&P. These are stocks which jumped over the lockdown period as current conditions support the transition to tech.
The push high is also being driven by a rally in a handful of tech giants Facebook, Amazon, Microsoft, Apple and Google parent Alphabet. These tech giants make up around 20% of the weight of the S&P. These are stocks which jumped over the lockdown period as current conditions support the transition to tech.
Looking East
The US lags around 2 months behind China in coronavirus crisis terms – both outbreak and recovery. China’s economy is showing a gradual recovery. The composite PMI is back above where it was at the start of the year despite halving in January, and factory profits are down -4.3% year on year, a significant improvement from the -35% decline in March, although still far from ideal.
The US lags around 2 months behind China in coronavirus crisis terms – both outbreak and recovery. China’s economy is showing a gradual recovery. The composite PMI is back above where it was at the start of the year despite halving in January, and factory profits are down -4.3% year on year, a significant improvement from the -35% decline in March, although still far from ideal.
Continuing claims
Whilst initial jobless claims have been a strong focus over the past two weeks continuing claims will now attract more attention for signs of job seekers being re-hired as states reopen their economies. Whilst the S&P has risen higher regardless of horrendous jobless claims data, surely at some point if continuing claims don't show signs of improvement the push higher will reverse or at the very least start to slow? Regardless of what we think the S&P should be doing the chart is bullish.
S&P levels to watch:
The S&P trades above its 20, 50 & 100 sma on 4 hour chart, a bullish chart.
Immediate resistance can be seen at 3082 a psychologically key level prior to the coronavirus crisis March 5th high, prior to 3130 (high 4th March).
Support can be seen at 2984 (yesterday low) 2906 (low 22nd May) and 2760 (low 14th May).
Related tags:
Latest market news




The complete CFD trading experience
Award-winning platforms, competitive spreads, low commissions and dedicated support.
We live and breathe the markets and are dedicated to helping traders realise their ambitions as we continue to set the industry bar.
Economic calendar
Web Trader platform
Our sophisticated web-based platform is packed with features.
Related articles

S&P 500 forecast: Stocks extend drop as correction risks grow
US and global equity markets have extended Wednesday’s sell-off, with Wall Street opening lower after a weak handover from Asia and Europe. The deterioration in risk appetite has been spreading across global markets. The dollar was firmer, Treasury yields were holding onto yesterday’s gains, while gold, silver and bitcoin were all under pressure alongside equities and major currencies.


Nikkei threatens breakout as tech rebound broadens
Breakouts across the SOX and Nasdaq are being matched by rebounds across Asia, with the Nikkei now threatening to join the move.


Nasdaq 100 Forecast: Confidence Returns as the Index Challenges Record Highs
The trading week is getting underway with renewed bullish momentum across Nasdaq. This is reflected in today's session, where the index has gained more than 2.5%, highlighting a buying bias that has not been observed with this level of strength in several weeks.
StoneX Europe Ltd may make third party material available on this website which may contain information included but not limited to the conditions of financial markets. The material is for information purposes only and does not contain, and should not be construed as containing, investment advice and/or investment recommendation and/or an investment research and/or an offer of or solicitation for any transactions in financial instruments; any decision to enter into a specific transaction shall be made by the client following an assessment by him/her of their situation.
StoneX Europe Ltd makes no representation or warranty and assumes no liability as to the accuracy or completeness of the information provided, nor any loss arising from any investment based on a recommendation, forecast or other information supplied. You should always seek independent advice as to your suitability to speculate in any related markets and your ability to assume the associated risks, if you are at all unsure. We are not under any obligation to update any such material. Any opinion made may be personal to the author and may not reflect the opinion of StoneX Europe Ltd.