



How much higher can gold move?
By the reaction after today’s ECI, it looks like gold bugs still mean business.
Share this:

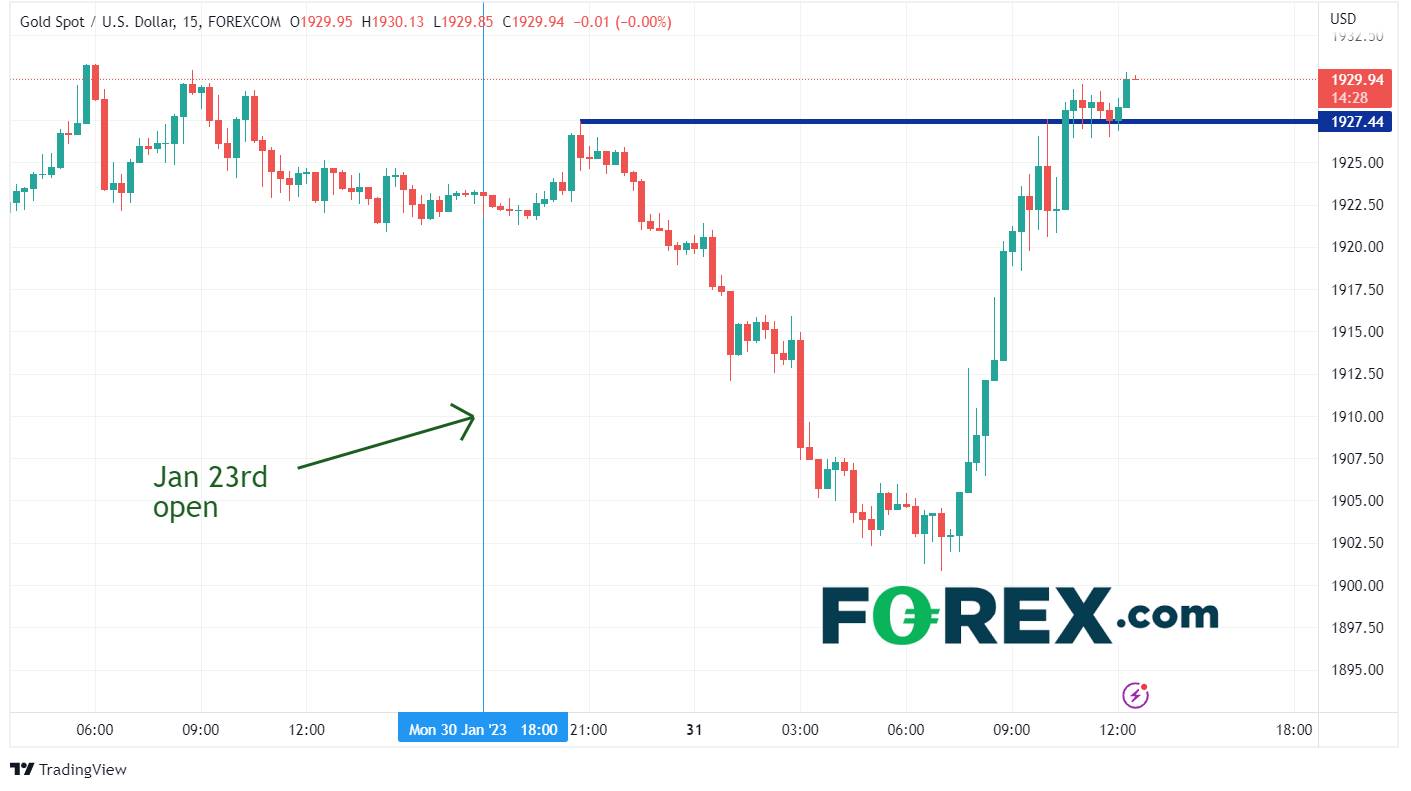
When the US walked in on Tuesday morning, Gold (XAU/USD) was getting pummeled. The precious metal was already down over $20, near 1900, and it looked like a route was in store for the US session. However, an hour before the US Employment Cost Index was released, Gold began to go bid. By the time the weaker than expected ECI was released at 8:30am ET, Gold was back to 1912.11. The weaker ECI (1.1% vs 1.2% expected), sent the US Dollar lower on hopes that a lower increase in wages may cause the Fed to be more dovish at its FOMC meeting tomorrow. With the US Dollar moving lower, it was off to the races for Gold, completely reversing the overnight move and sending it to new highs for the day.
Source: Tradingview, Stone X
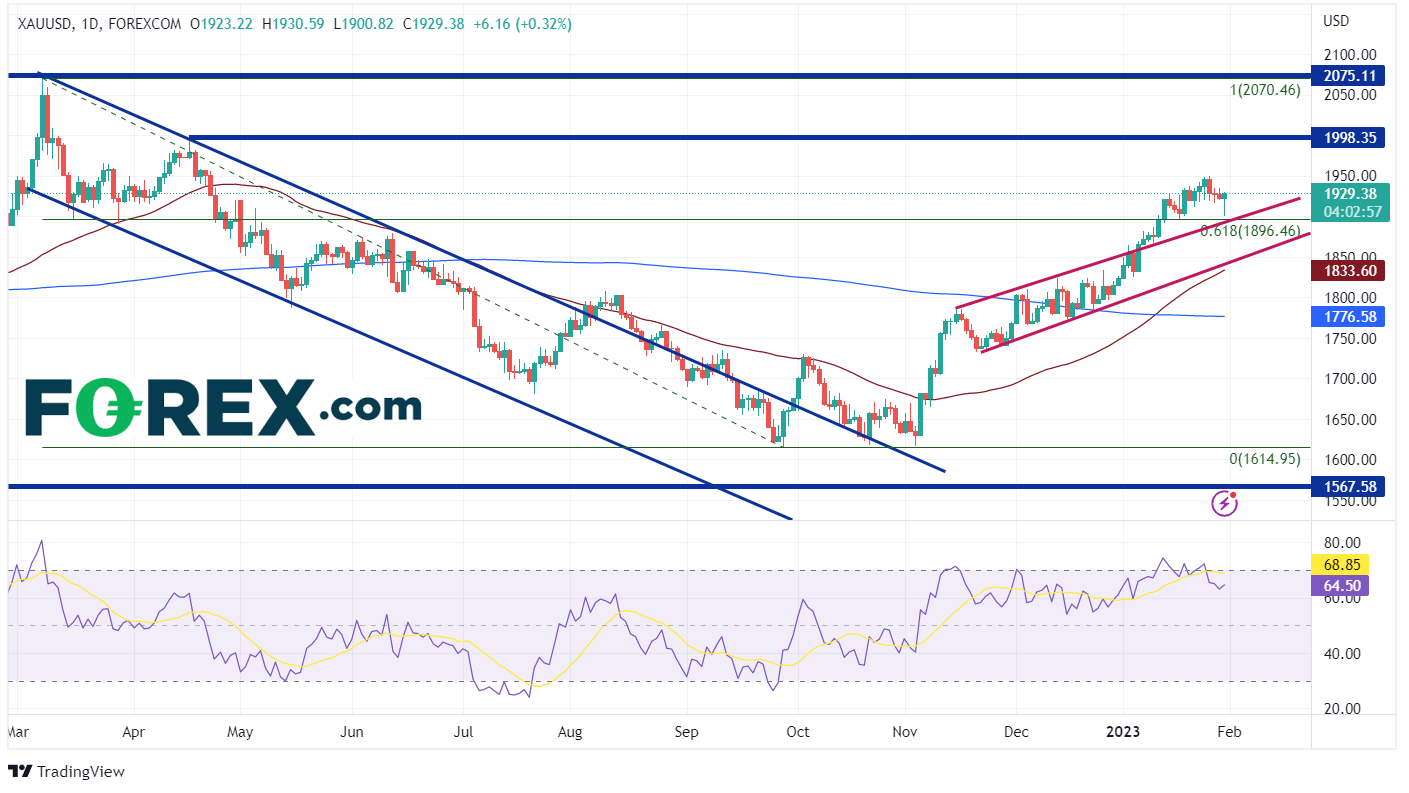
On a daily timeframe, XAU/USD had moved lower from 2070.46 on March 8th, 2022 to 1614.95 on September 28th, 2022 in an orderly downward sloping channel. On September 30th, Gold moved sideways out of the channel and then began to move aggressively higher. XAU/USD traded above the 50 Day Moving Average and formed a new upward sloping channel into the end of 2022, settling the year at 1823.92. On January 6th, Gold broke above the top trendline of the channel and then broke above the 61.8% Fibonacci retracement from the March 2022 highs to the September 2022 lows at 1896.46. Gold made a high of 1949.23 on January 26th, then profit taking ensued into the tomorrow’s FOMC meeting.
Source: Tradingview Stone X
On a 240-minute timeframe, Gold pulled back from the recent high and tested the top trendline of the channel but failed. If Gold continues to move higher, the first resistance is at the highs of January 26th at 1949.23. However, there is minimal resistance between there and the March 8th, 2022, highs at 2070.46. The only area stopping it is the highs from April 18th, 2022 at 1998.35. First support is at a confluence between the January 17th lows, today’s low, and the upward sloping trendline of the channel between 1896.68 and 1904.82. Below there, Gold can fall to the bottom of the channel near 1856, then horizontal support at 1824.48.

Source: Tradingview Stone X
By the reaction after today’s ECI, it looks like gold bugs still mean business. Everyone is expecting a 25bps hike from the FOMC and a hawkish Fed. If there is any hint of dovishness in the statement or Powell’s press conference which follows, Gold could be back near 2070 within a few days! However, if the Fed remains hawkish, the US Dollar may go bid and thus, Gold may pull back.
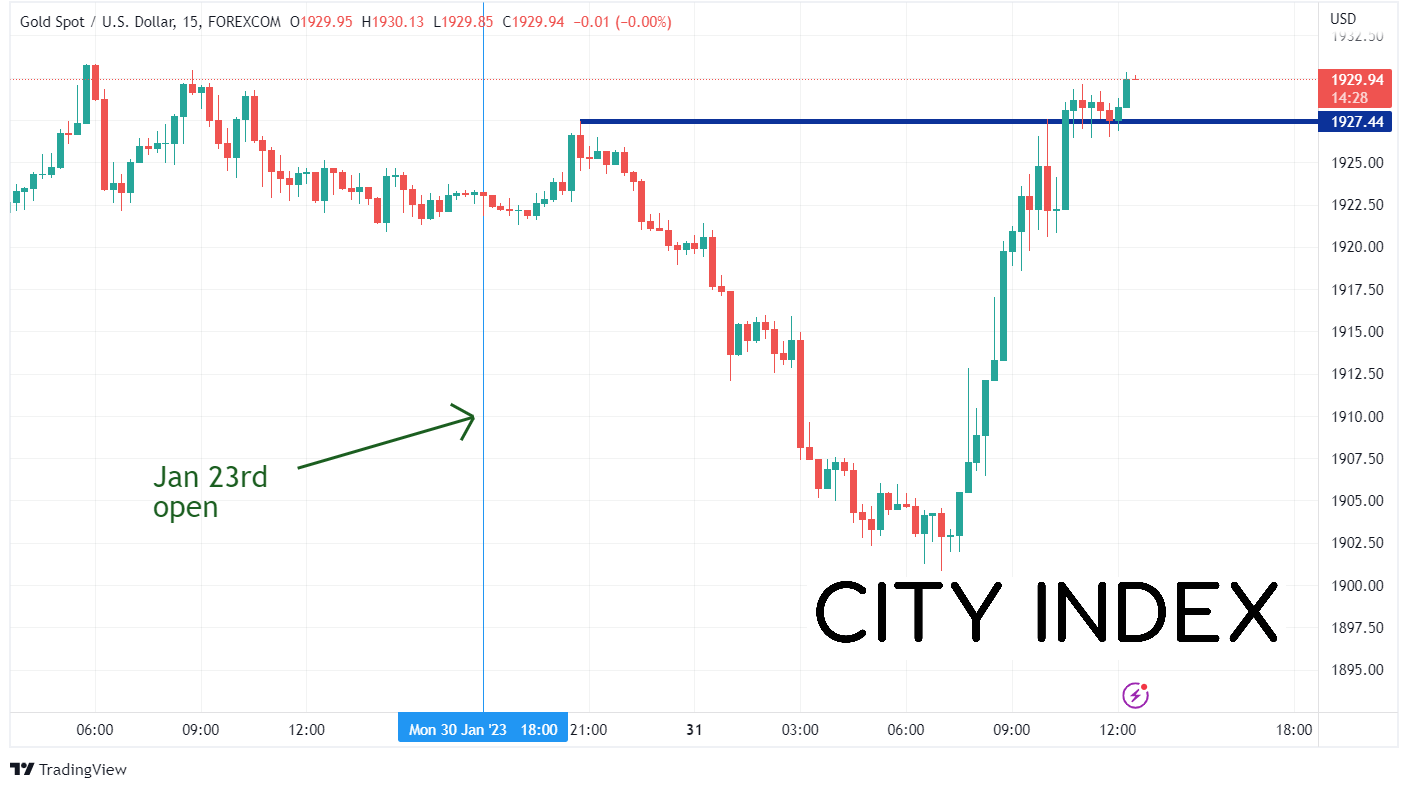
When the US walked in on Tuesday morning, Gold (XAU/USD) was getting pummeled. The precious metal was already down over $20, near 1900, and it looked like a route was in store for the US session. However, an hour before the US Employment Cost Index was released, Gold began to go bid. By the time the weaker than expected ECI was released at 8:30am ET, Gold was back to 1912.11. The weaker ECI (1.1% vs 1.2% expected), sent the US Dollar lower on hopes that a lower increase in wages may cause the Fed to be more dovish at its FOMC meeting tomorrow. With the US Dollar moving lower, it was off to the races for Gold, completely reversing the overnight move and sending it to new highs for the day.
Source: Tradingview, Stone X
On a daily timeframe, XAU/USD had moved lower from 2070.46 on March 8th, 2022 to 1614.95 on September 28th, 2022 in an orderly downward sloping channel. On September 30th, Gold moved sideways out of the channel and then began to move aggressively higher. XAU/USD traded above the 50 Day Moving Average and formed a new upward sloping channel into the end of 2022, settling the year at 1823.92. On January 6th, Gold broke above the top trendline of the channel and then broke above the 61.8% Fibonacci retracement from the March 2022 highs to the September 2022 lows at 1896.46. Gold made a high of 1949.23 on January 26th, then profit taking ensued into the tomorrow’s FOMC meeting.

Source: Tradingview Stone X
Trade Gold now: Login or Open a new account!
• Open an account in the UK
• Open an account in Australia
• Open an account in Singapore
On a 240-minute timeframe, Gold pulled back from the recent high and tested the top trendline of the channel but failed. If Gold continues to move higher, the first resistance is at the highs of January 26th at 1949.23. However, there is minimal resistance between there and the March 8th, 2022, highs at 2070.46. The only area stopping it is the highs from April 18th, 2022 at 1998.35. First support is at a confluence between the January 17th lows, today’s low, and the upward sloping trendline of the channel between 1896.68 and 1904.82. Below there, Gold can fall to the bottom of the channel near 1856, then horizontal support at 1824.48.

Source: Tradingview Stone X
By the reaction after today’s ECI, it looks like gold bugs still mean business. Everyone is expecting a 25bps hike from the FOMC and a hawkish Fed. If there is any hint of dovishness in the statement or Powell’s press conference which follows, Gold could be back near 2070 within a few days! However, if the Fed remains hawkish, the US Dollar may go bid and thus, Gold may pull back.
Learn more about forex trading opportunities.
Related tags:



The complete CFD trading experience
Award-winning platforms, competitive spreads, low commissions and dedicated support.
We live and breathe the markets and are dedicated to helping traders realise their ambitions as we continue to set the industry bar.
Economic calendar
Web Trader platform
Our sophisticated web-based platform is packed with features.
Related articles
Oil, Gold Forecast: Two trades to watch 280926
Oil Rises as U.S.-Iran Peace Hopes Fade. Gold Breaks Down on Hawkish Fed Expectations as Treasury Yields and USD Rise.

Gold Outlook: XAU/USD hit hard as US yields, dollar resume ascent
A stronger dollar, surging front-end yields and renewed geopolitical tension have combined to push gold back towards key technical support.


EUR/USD weekly outlook: Oil, inflation and NFP in focus
After coming under significant pressure in recent weeks, the EUR/USD came off its lows to finish the week on a positive note on Friday, albeit with only a mild rebound. That was not enough to prevent the exchange rate falling for the third consecutive week, as the US dollar and bond yields rallied across the board.

StoneX Europe Ltd may make third party material available on this website which may contain information included but not limited to the conditions of financial markets. The material is for information purposes only and does not contain, and should not be construed as containing, investment advice and/or investment recommendation and/or an investment research and/or an offer of or solicitation for any transactions in financial instruments; any decision to enter into a specific transaction shall be made by the client following an assessment by him/her of their situation.
StoneX Europe Ltd makes no representation or warranty and assumes no liability as to the accuracy or completeness of the information provided, nor any loss arising from any investment based on a recommendation, forecast or other information supplied. You should always seek independent advice as to your suitability to speculate in any related markets and your ability to assume the associated risks, if you are at all unsure. We are not under any obligation to update any such material. Any opinion made may be personal to the author and may not reflect the opinion of StoneX Europe Ltd.