



Index in Focus: China A50
Poor economic data combined with the constant closing and re-opening of certain areas in China have the China A50 on its heels.
Share this:

The news out of China lately hasn’t been great. China’s Caixin Manufacturing PMI released earlier today for August was 49.5 vs 50.2 expected and 50.4 in July. This is the lowest level since May and puts the Chinese economy under the 50 expansion/contraction level. Major reasons for the lower print include power outages and the ongoing closing and opening of cities due to Covid. Speaking of Covid, China has placed its 4th largest city, Chengdu, under lockdown. This region accounts for 1.75% of the country’s GDP. In addition, parts of China’s largest tech hub, Shenzhen, had several areas placed under lockdown. To make matters worse, the US has ordered Nvidia and AMD to halt sending AI chips to China and Russia. This all comes on the heels of poor economic data, including Industrial Production and Retail Sales. In addition, China’s housing sector has been plummeting due to failing property developers. Can the China A50 recover as it approaches its May lows?
The China A50 had been moving in a symmetrical triangle since mid-June 2015. However, on July 3rd, 2020, the index busted through the top of the wedge near 14700 and by February 18th, 2021, it reached an all-time high of 20603.10! Since then, the index has been moving lower, as concerns of inflation, an economic slowdown, and an increase of Covid cases began to move through China. Price tested the previously mentioned top trendline of the long-term triangle numerous times, only to finally come crashing through it on March 7th, 2022. Since May 2021, the China A50 has also been moving lower in a downward sloping channel, reaching a near-term low of 13186 in mid-March of this year.

Source: Tradingview, Stone X
Trade the China A50 now: Login or open a new account!
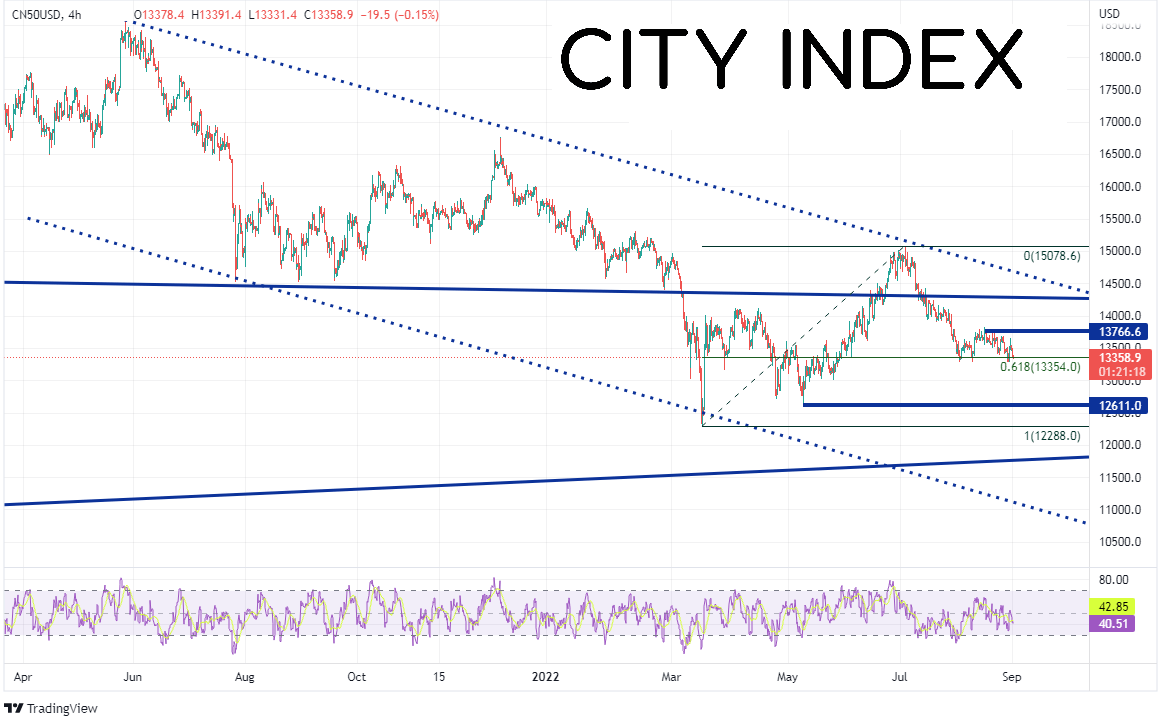
On a 240-minute timeframe, the China A50 is trading near the 61.8% Fibonacci retracement level from the lows of March 15th to the highs of July 5th, near 13354. If price breaks, the next level of horizontal support is at 12611, and then the lows of March 15th at 12288. Below there, price can fall to the bottom trendline of the long-term triangle near 11800. However, if the support holds and price bounces, first resistance is at highs from August 15th at 12766.6. Above there, resistance is at the top trendline of the previously mentioned long term triangle near 14270 and then the top, downward sloping trendline from the channel near 14690.

Source: Tradingview, Stone X
Poor economic data combined with the constant closing and re-opening of certain areas in China have the China A50 on its heels. Will the Index continue to move lower? The 61.8% Fibonacci retracement level from March 15th to July 5th may be the key level to watch!
Learn more about forex trading opportunities.
The news out of China lately hasn’t been great. China’s Caixin Manufacturing PMI released earlier today for August was 49.5 vs 50.2 expected and 50.4 in July. This is the lowest level since May and puts the Chinese economy under the 50 expansion/contraction level. Major reasons for the lower print include power outages and the ongoing closing and opening of cities due to Covid. Speaking of Covid, China has placed its 4th largest city, Chengdu, under lockdown. This region accounts for 1.75% of the country’s GDP. In addition, parts of China’s largest tech hub, Shenzhen, had several areas placed under lockdown. To make matters worse, the US has ordered Nvidia and AMD to halt sending AI chips to China and Russia. This all comes on the heels of poor economic data, including Industrial Production and Retail Sales. In addition, China’s housing sector has been plummeting due to failing property developers. Can the China A50 recover as it approaches its May lows?
The China A50 had been moving in a symmetrical triangle since mid-June 2015. However, on July 3rd, 2020, the index busted through the top of the wedge near 14700 and by February 18th, 2021, it reached an all-time high of 20603.10! Since then, the index has been moving lower, as concerns of inflation, an economic slowdown, and an increase of Covid cases began to move through China. Price tested the previously mentioned top trendline of the long-term triangle numerous times, only to finally come crashing through it on March 7th, 2022. Since May 2021, the China A50 has also been moving lower in a downward sloping channel, reaching a near-term low of 13186 in mid-March of this year.

Source: Tradingview, Stone X
Trade the China A50 now: Login or Open a new account!
• Open an account in the UK
• Open an account in Australia
• Open an account in Singapore
On a 240-minute timeframe, the China A50 is trading near the 61.8% Fibonacci retracement level from the lows of March 15th to the highs of July 5th, near 13354. If price breaks, the next level of horizontal support is at 12611, and then the lows of March 15th at 12288. Below there, price can fall to the bottom trendline of the long-term triangle near 11800. However, if the support holds and price bounces, first resistance is at highs from August 15th at 12766.6. Above there, resistance is at the top trendline of the previously mentioned long term triangle near 14270 and then the top, downward sloping trendline from the channel near 14690.
Source: Tradingview, Stone X
Poor economic data combined with the constant closing and re-opening of certain areas in China have the China A50 on its heels. Will the Index continue to move lower? The 61.8% Fibonacci retracement level from March 15th to July 5th may be the key level to watch!
Learn more about forex trading opportunities.
Related tags:



The complete CFD trading experience
Award-winning platforms, competitive spreads, low commissions and dedicated support.
We live and breathe the markets and are dedicated to helping traders realise their ambitions as we continue to set the industry bar.
Economic calendar
Web Trader platform
Our sophisticated web-based platform is packed with features.
Related articles
ASX 200 Outlook: A Rates Trade Disguised as a Stock Market?
Australian bond futures have exhibited a far stronger relationship with the ASX 200 than Wall Street over recent months. Now both markets are displaying remarkably similar price structures.

AUD/USD Bulls Fight Back After Australian Jobs Shock
AUD/USD has been hit by another ugly Australian employment report, sending RBA rate hike expectations sharply lower. Yet the relationships driving the currency have shifted since quarter-end, and improving risk appetite could provide the fuel for a recovery.

Gold outlook: Metal rebounds but downside risks persist
For now, at least, my near-term gold outlook remains modestly bearish, even if I have a strong long-term bullish bias towards gold and especially silver.

StoneX Europe Ltd may make third party material available on this website which may contain information included but not limited to the conditions of financial markets. The material is for information purposes only and does not contain, and should not be construed as containing, investment advice and/or investment recommendation and/or an investment research and/or an offer of or solicitation for any transactions in financial instruments; any decision to enter into a specific transaction shall be made by the client following an assessment by him/her of their situation.
StoneX Europe Ltd makes no representation or warranty and assumes no liability as to the accuracy or completeness of the information provided, nor any loss arising from any investment based on a recommendation, forecast or other information supplied. You should always seek independent advice as to your suitability to speculate in any related markets and your ability to assume the associated risks, if you are at all unsure. We are not under any obligation to update any such material. Any opinion made may be personal to the author and may not reflect the opinion of StoneX Europe Ltd.