



Is the manufacturing sector telling us something?
Are these large drops in the manufacturing data indicative of a slowdown ahead in the rest of the economy?
Share this:

Earlier in the week, the US began releasing its assessment of the manufacturing sector for May by publishing the first of its regional manufacturing outlooks gauges: The NY Empire State Manufacturing Index and the Philadelphia Fed Manufacturing Index. The former was much worse than expected, with a headline print of -11.6 vs an expectation of 17 and an April reading of 24.6! The prices paid component fell to 73.7 vs 86.4 last. The more closely watched Philly Fed Manufacturing Index headline print for May was 2.6 vs an expectation of 16 and an April reading of 17.6. The prices paid component also fell, from 84.6 to 78.9. In addition, the Employment component fell from 41.4 down to 25.5. Manufacturing data tends to lead the rest of the market data in that it is the first stage where one would see an increase or decrease of activity. Are these large drops in the manufacturing data indicative of a slowdown ahead in the rest of the economy?
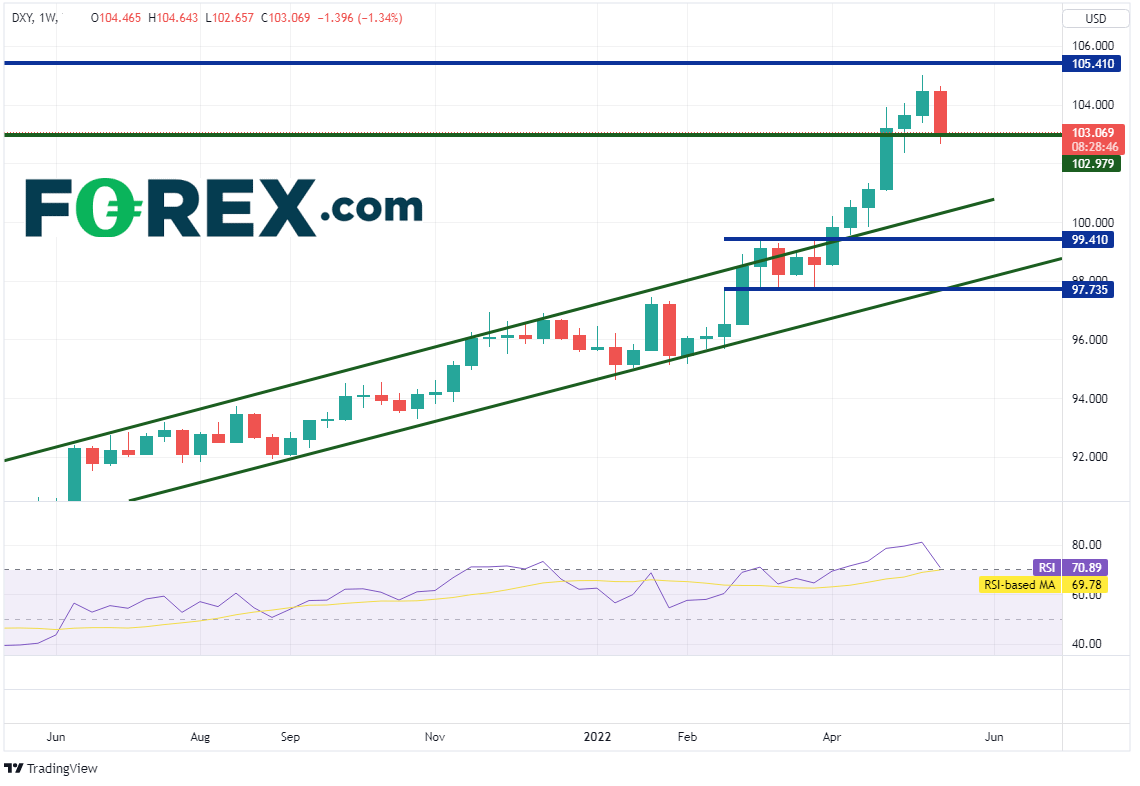
The US Dollar Index seems to think something may be ahead. Traditionally, stock market indices and the US dollar tend to move in opposite directions, that is, when stocks are moving lower, the US Dollar tends to move higher. However, on Wednesday while the S&P 500 and NASDAQ were down over 4%, the US Dollar Index (DXY) was only slightly higher at +0.5%. Could US Dollar traders be worried about slowing growth and stagflation? On Thursday, stock markets closed in the red once again and the US Dollar Index continued lower, down 1% and back below the pandemic highs of 102.98. The index appears to be in for its first weekly lose in 6 weeks. (For a complete look at the DXY, see my colleague Fawad Razaqzada’s Forex Friday!)
Source: Tradingview, Stone X
EUR/USD, which is almost 100% negatively correlated with the DXY, has moved in the opposite direction of the US Dollar Index this week and will have formed a bullish engulfing pattern if the pair closes above 1.0544. First resistance on the weekly timeframe is at the lows from the week of March 7th, near 1.0806. Above there, the pair can trade to the 38.2% Fibonacci retracement level from the highs of 2022 to last week’s low, near 1.1113. However, if the DXY decides to continue its move higher, EUR/USD should move lower. First support is at last week’s low of 1.0349, which confluences with the 2017 lows at 1.0340. Below there, the pair can fall all the way to parity (1.00), which is the next psychological round number support level.

Source: Tradingview, Stone X
Will the US manufacturing sector continue to paint a deteriorating picture for the economy? Next week the US will release manufacturing indexes from Richmond and Kansas. In addition, the S&P Global Composite PMI Flash for May will be released. Watch to see if the actual data is much weaker than expectations. If so, traders may continue selling the DXY on fears of a slowdown or a recession.
Earlier in the week, the US began releasing its assessment of the manufacturing sector for May by publishing the first of its regional manufacturing outlooks gauges: The NY Empire State Manufacturing Index and the Philadelphia Fed Manufacturing Index. The former was much worse than expected, with a headline print of -11.6 vs an expectation of 17 and an April reading of 24.6! The prices paid component fell to 73.7 vs 86.4 last. The more closely watched Philly Fed Manufacturing Index headline print for May was 2.6 vs an expectation of 16 and an April reading of 17.6. The prices paid component also fell, from 84.6 to 78.9. In addition, the Employment component fell from 41.4 down to 25.5. Manufacturing data tends to lead the rest of the market data in that it is the first stage where one would see an increase or decrease of activity. Are these large drops in the manufacturing data indicative of a slowdown ahead in the rest of the economy?
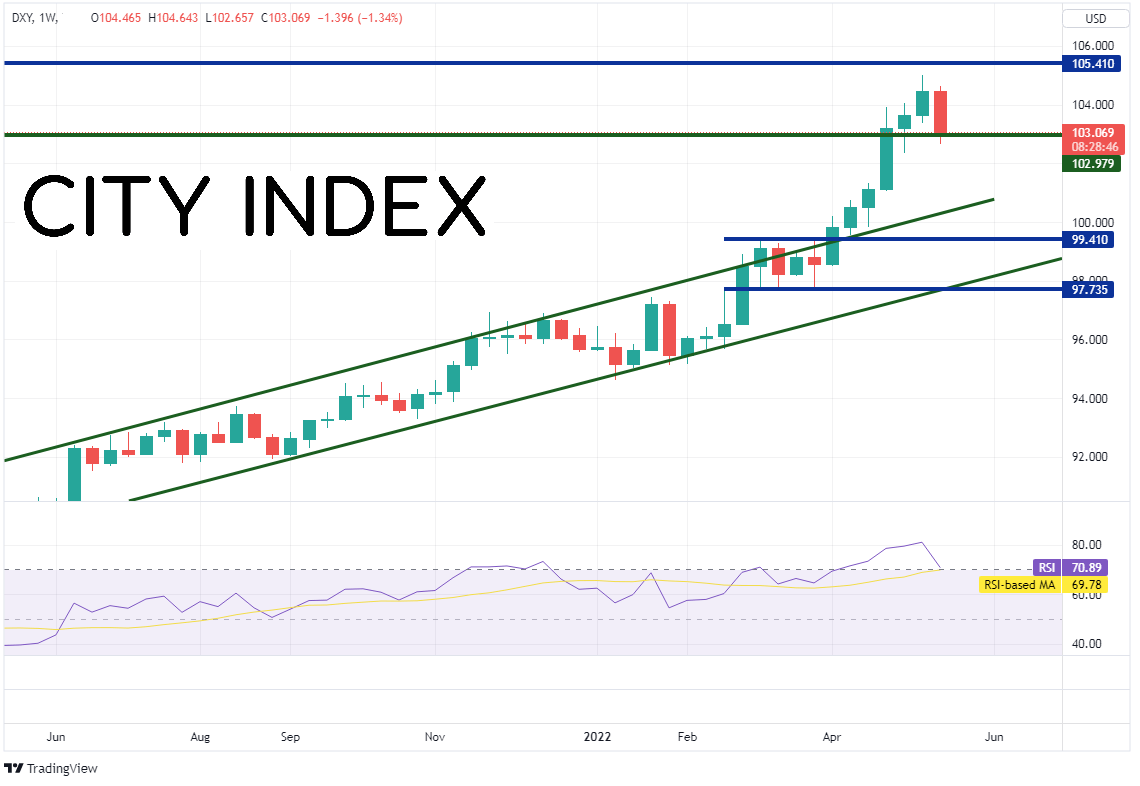
The US Dollar Index seems to think something may be ahead. Traditionally, stock market indices and the US dollar tend to move in opposite directions, that is, when stocks are moving lower, the US Dollar tends to move higher. However, on Wednesday while the S&P 500 and NASDAQ were down over 4%, the US Dollar Index (DXY) was only slightly higher at +0.5%. Could US Dollar traders be worried about slowing growth and stagflation? On Thursday, stock markets closed in the red once again and the US Dollar Index continued lower, down 1% and back below the pandemic highs of 102.98. The index appears to be in for its first weekly lose in 6 weeks. (For a complete look at the DXY, see my colleague Fawad Razaqzada’s Forex Friday!)
Source: Tradingview, Stone X
Trade DXY now: Login or Open a new account!
• Open an account in the UK
• Open an account in Australia
• Open an account in Singapore
EUR/USD, which is almost 100% negatively correlated with the DXY, has moved in the opposite direction of the US Dollar Index this week and will have formed a bullish engulfing pattern if the pair closes above 1.0544. First resistance on the weekly timeframe is at the lows from the week of March 7th, near 1.0806. Above there, the pair can trade to the 38.2% Fibonacci retracement level from the highs of 2022 to last week’s low, near 1.1113. However, if the DXY decides to continue its move higher, EUR/USD should move lower. First support is at last week’s low of 1.0349, which confluences with the 2017 lows at 1.0340. Below there, the pair can fall all the way to parity (1.00), which is the next psychological round number support level.

Source: Tradingview, Stone X
Trade EUR/USD now: Login or Open a new account!
• Open an account in the UK
• Open an account in Australia
• Open an account in Singapore
Will the US manufacturing sector continue to paint a deteriorating picture for the economy? Next week the US will release manufacturing indexes from Richmond and Kansas. In addition, the S&P Global Composite PMI Flash for May will be released. Watch to see if the actual data is much weaker than expectations. If so, traders may continue selling the DXY on fears of a slowdown or a recession.
Learn more about forex trading opportunities.
Related tags:
Latest market news




The complete CFD trading experience
Award-winning platforms, competitive spreads, low commissions and dedicated support.
We live and breathe the markets and are dedicated to helping traders realise their ambitions as we continue to set the industry bar.
Economic calendar
Web Trader platform
Our sophisticated web-based platform is packed with features.
Related articles
Japanese Yen Forecast: USD/JPY 4% Rally Challenges Post-Intervention Downtrend 9 24 2026
USD/JPY momentum has shifted sharply higher, putting a major resistance confluence in focus as U.S. and Japanese event risk builds.

Oil Quietly Hands the Fed a Reason to Stay Hawkish
Oil prices and the U.S. dollar are both on the front foot as elevated energy costs feed Fed warnings that inflation may prove sticky.

S&P 500 forecast: Stocks extend drop as correction risks grow
US and global equity markets have extended Wednesday’s sell-off, with Wall Street opening lower after a weak handover from Asia and Europe. The deterioration in risk appetite has been spreading across global markets. The dollar was firmer, Treasury yields were holding onto yesterday’s gains, while gold, silver and bitcoin were all under pressure alongside equities and major currencies.
StoneX Europe Ltd may make third party material available on this website which may contain information included but not limited to the conditions of financial markets. The material is for information purposes only and does not contain, and should not be construed as containing, investment advice and/or investment recommendation and/or an investment research and/or an offer of or solicitation for any transactions in financial instruments; any decision to enter into a specific transaction shall be made by the client following an assessment by him/her of their situation.
StoneX Europe Ltd makes no representation or warranty and assumes no liability as to the accuracy or completeness of the information provided, nor any loss arising from any investment based on a recommendation, forecast or other information supplied. You should always seek independent advice as to your suitability to speculate in any related markets and your ability to assume the associated risks, if you are at all unsure. We are not under any obligation to update any such material. Any opinion made may be personal to the author and may not reflect the opinion of StoneX Europe Ltd.