




Is the US housing market a bit frothy
Home sales seem to be slowing while prices are rising. At some point, prices will need to decline to induce more demand
Share this:

Buying and selling your house may soon get a little tougher. Last week, Existing Homes Sales for May were released. The print was 5.8 million, the lowest reading in 11 months, and it’s approaching pre-pandemic levels. New Homes Sales for May were also released last week. The print was 769,000 (annualized), the lowest reading in over 1 year. Pending home sales for May released Wednesday showed a 13.1% YoY increase vs +25% expected. This was the lowest reading since July 2020. (However, we should note that the MoM print was +8% vs -2% expected. With lower sales, and higher pending sales, one could speculate that next months pending home sales will be lower.)
The S&P CoreLogic Case-Schiller 20-city home price index was released on Tuesday. The index rose 14.9% in April, and the March print was revised higher to 13.4%. This was the largest annual increase in 21 years!
Although housing sales are nearing pre-pandemic levels, price levels are much higher due to low interest rates. However, some homebuyers, especially first-time house buyers, are being priced out of the market. As we can see from the data, housing sales have already begun to slow. At some point prices will have to be lowered, as demand won’t be there. This is especially true at lower price points. This seems to be representative of many countries around the world, and central banks have noticed. Some have explicitly mentioned they are concerned about the housing prices. In statements by US Fed officials, some have mentioned that one of the first things the Fed can do once they begin tapering is to reduce the amount of MBS purchases. The Fed is currently buying $40 billion per month in MBS (as part of the $120 billion per month in total bond purchases).
Everything you need to know about the Federal Reserve
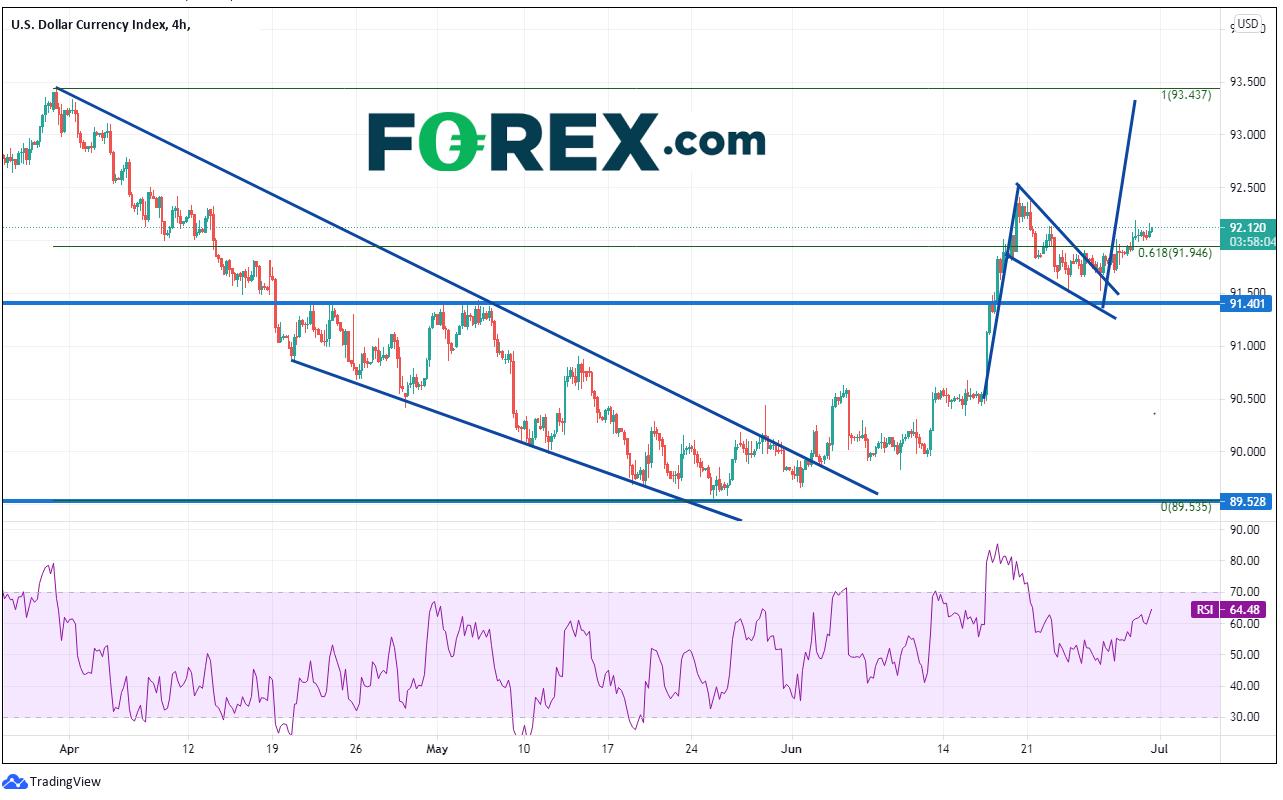
We’ve been paying a lot of attention to the DXY lately, especially since the last FOMC meeting on June 16th. On a 240-minute timeframe, price broke higher from a descending wedge in early June. However, it wasn’t until the FOMC meeting on June 16th that the index began to move aggressively. Due to the hawkish-tilt from the FOMC, the US Dollar Index began moving higher in earnest to the 61.8% Fibonacci retracement level from the March 31st highs to the May 25th lows, near 92.00. The index pulled back in a pennant formation. Notice how the RSI was in overbought territory near 85 before price pulled back. On June 25, DXY moved out of the pennant and began moving towards its target. The target for a pennant is the length of the pennant pole added to the breakout point of the pennant, which points to 93.37, just pips shy of the target for the retracement of the wedge, which is 93.44.
Source: Tradingview, City Index
If traders wish to trade the DXY but don’t have access to it, 2 alternatives are USD/CHF and USD/SEK, which have high positive correlations to the DXY. Below are 2 recent articles which show these correlations:
DXY isn’t a currency pair, but USD/CHF is!
Sweden’s in trouble, and it has nothing to do with Euro 2020
Home sales seem to be slowing while prices are rising. At some point (probably sooner than later), prices will need to decline to induce more demand. Once the Fed begins tapering, MBS purchases may be the first to go, which would raise rates in the mortgage arena, and therefore, cause prices to come down.
Learn more about forex trading opportunities.
Buying and selling your house may soon get a little tougher. Last week, Existing Homes Sales for May were released. The print was 5.8 million, the lowest reading in 11 months, and it’s approaching pre-pandemic levels. New Homes Sales for May were also released last week. The print was 769,000 (annualized), the lowest reading in over 1 year. Pending home sales for May released Wednesday showed a 13.1% YoY increase vs +25% expected. This was the lowest reading since July 2020. (However, we should note that the MoM print was +8% vs -2% expected. With lower sales, and higher pending sales, one could speculate that next months pending home sales will be lower.)
The S&P CoreLogic Case-Schiller 20-city home price index was released on Tuesday. The index rose 14.9% in April, and the March print was revised higher to 13.4%. This was the largest annual increase in 21 years!
Although housing sales are nearing pre-pandemic levels, price levels are much higher due to low interest rates. However, some homebuyers, especially first-time house buyers, are being priced out of the market. As we can see from the data, housing sales have already begun to slow. At some point prices will have to be lowered, as demand won’t be there. This is especially true at lower price points. This seems to be representative of many countries around the world, and central banks have noticed. Some have explicitly mentioned they are concerned about the housing prices. In statements by US Fed officials, some have mentioned that one of the first things the Fed can do once they begin tapering is to reduce the amount of MBS purchases. The Fed is currently buying $40 billion per month in MBS (as part of the $120 billion per month in total bond purchases).
We’ve been paying a lot of attention to the DXY lately, especially since the last FOMC meeting on June 16th. On a 240-minute timeframe, price broke higher from a descending wedge in early June. However, it wasn’t until the FOMC meeting on June 16th that the index began to move aggressively. Due to the hawkish-tilt from the FOMC, the US Dollar Index began moving higher in earnest to the 61.8% Fibonacci retracement level from the March 31st highs to the May 25th lows, near 92.00. The index pulled back in a pennant formation. Notice how the RSI was in overbought territory near 85 before price pulled back. On June 25, DXY moved out of the pennant and began moving towards its target. The target for a pennant is the length of the pennant pole added to the breakout point of the pennant, which points to 93.37, just pips shy of the target for the retracement of the wedge, which is 93.44.
Source: Tradingview, FOREX.com
If traders wish to trade the DXY but don’t have access to it, 2 alternatives are USD/CHF and USD/SEK, which have high positive correlations to the DXY. Below are 2 recent articles which show these correlations:
DXY isn’t a currency pair, but USD/CHF is!
Sweden’s in trouble, and it has nothing to do with Euro 2020
Home sales seem to be slowing while prices are rising. At some point (probably sooner than later), prices will need to decline to induce more demand. Once the Fed begins tapering, MBS purchases may be the first to go, which would raise rates in the mortgage arena, and therefore, cause prices to come down.
Related tags:
Latest market news




The complete CFD trading experience
Award-winning platforms, competitive spreads, low commissions and dedicated support.
We live and breathe the markets and are dedicated to helping traders realise their ambitions as we continue to set the industry bar.
Economic calendar
Web Trader platform
Our sophisticated web-based platform is packed with features.
Related articles
Gold Outlook: XAU/USD hit hard as US yields, dollar resume ascent
A stronger dollar, surging front-end yields and renewed geopolitical tension have combined to push gold back towards key technical support.
EUR/USD weekly outlook: Oil, inflation and NFP in focus
After coming under significant pressure in recent weeks, the EUR/USD came off its lows to finish the week on a positive note on Friday, albeit with only a mild rebound. That was not enough to prevent the exchange rate falling for the third consecutive week, as the US dollar and bond yields rallied across the board.


USD/JPY Weekly Outlook: Payrolls loom as US rates remain the dominant driver
Strong US growth and hawkish Fed pricing continue to support USD/JPY, while intervention risk appears to be kicking in at lower levels
StoneX Europe Ltd may make third party material available on this website which may contain information included but not limited to the conditions of financial markets. The material is for information purposes only and does not contain, and should not be construed as containing, investment advice and/or investment recommendation and/or an investment research and/or an offer of or solicitation for any transactions in financial instruments; any decision to enter into a specific transaction shall be made by the client following an assessment by him/her of their situation.
StoneX Europe Ltd makes no representation or warranty and assumes no liability as to the accuracy or completeness of the information provided, nor any loss arising from any investment based on a recommendation, forecast or other information supplied. You should always seek independent advice as to your suitability to speculate in any related markets and your ability to assume the associated risks, if you are at all unsure. We are not under any obligation to update any such material. Any opinion made may be personal to the author and may not reflect the opinion of StoneX Europe Ltd.