







Its A Fine Line Between Bullish and Bearish on SP500
Share this:

As we highlighted in prior analysis, two bearish monthly candles warn of a potential top, although whilst prices hold key support bulls are well within their rights to have another crack at the highs. And they may take comfort in the fact that the S&P500 has closed higher 63.3% of the time in October over the past 30 years, and this bullish bias increases to 73.3% and 76.7% for November and December.
We can see on the S&P500 daily chart that the gap has nearly closed and (so far) provided support. A potential corrective channel is forming, so bulls could take a break of the descending trendline as a signal prices are headed back towards their highs. Yet given the choppy nature of price action we’re also on guard for a break beneath the support zone. So we’ll continue to monitor S&P500 stocks for both long and short setups.
- For bullish setups on the index, we’d prefer to see the support zone hold and / or prices break above the retracement line. The all-time highs are the initial target, before keeping an open target if it break highs.
- A clear break beneath the support zone suggests we’re in for a deeper correction / part of a larger top. However, a minor close beneath support may not cut it, given the choppy nature of price action.
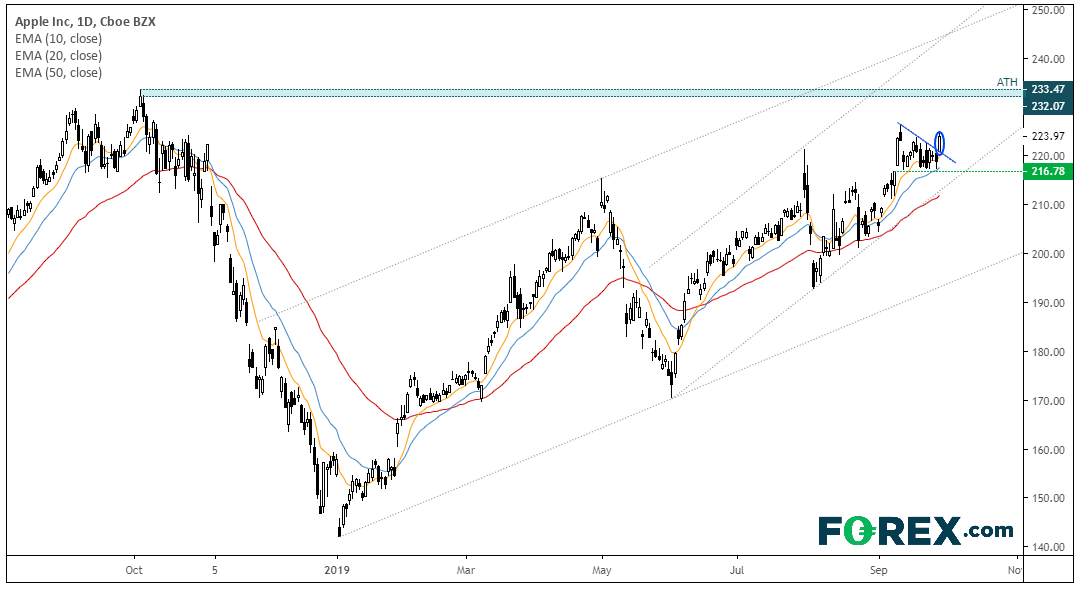
Apple has broken out of compression with a firm close above its retracement line. Two bullish channels remain in play and the stock is now accelerating away from the lower trendline of the internal channel. The 20-day eMA also provided support ahead of yesterday’s breakout.
- The near-term bias remains bullish above 216.78 support, or a break beneath yesterday’s low could also be used for a more aggrieve approach to risk management. There is also the lower channel to consider, but it becomes a question of reward to risk.
- Bulls can use the highs around 233 as a target but, given the overall trend structure, an open upside target could also be considered.
Netflix appears to be setting itself up for a dead cat bounce. Since the prior analysis, bears pushed the stock to a fresh YTD low which dragged RSI to oversold, yet price action remains firmly bearish. Yes, a slight bullish divergence with RSI has formed but a momentum low doesn’t always mark a price low. Besides, now prices are consolidating it allows time for RSI to recalibrate. And whilst resistance levels hold, bears aren’t likely to flee.
- The daily trend remains bearish below 300, although the zone around the broken trendline and 275.79 – 282.66 makes a tempting area for bears to fade into.
- For fading (shorting into a rising market, in this case) we’d want volatility to remain low. Keep in mind that without news to knock this lower, patterns such as dead cat bounces can go on for some time as they slowly grind higher. So, an earlier entry may require a wider stop.
- Alternatively, bears could wait for bearish momentum to return before assuming the dead cat bounce has completed, then use the 230 low as an initial target.
As we highlighted in last week’s video, two bearish monthly candles warn of a potential top, although whilst prices hold key support bulls are well within their rights to have another crack at the highs. And they may take comfort in the fact that the S&P500 has closed higher 63.3% of the time in October over the past 30 years, and this bullish bias increases to 73.3% and 76.7% for November and December.
We can see on the S&P500 daily chart that the gap has nearly closed and (so far) provided support. A potential corrective channel is forming, so bulls could take a break of the descending trendline as a signal prices are headed back towards their highs. Yet given the choppy nature of price action we’re also on guard for a break beneath the support zone. So we’ll continue to monitor S&P500 stocks for both long and short setups.
- For bullish setups on the index, we’d prefer to see the support zone hold and / or prices break above the retracement line. The all-time highs are the initial target, before keeping an open target if it break highs.
- A clear break beneath the support zone suggests we’re in for a deeper correction / part of a larger top. However, a minor close beneath support may not cut it, given the choppy nature of price action.
Apple has broken out of compression with a firm close above its retracement line. Two bullish channels remain in play and the stock is now accelerating away from the lower trendline of the internal channel. The 20-day eMA also provided support ahead of yesterday’s breakout.
- The near-term bias remains bullish above 216.78 support, or a break beneath yesterday’s low could also be used for a more aggrieve approach to risk management. There is also the lower channel to consider, but it becomes a question of reward to risk.
- Bulls can use the highs around 233 as a target but, given the overall trend structure, an open upside target could also be considered.
Netflix appears to be setting itself up for a dead cat bounce. Since the prior analysis, bears pushed the stock to a fresh YTD low which dragged RSI to oversold, yet price action remains firmly bearish. Yes, a slight bullish divergence with RSI has formed but a momentum low doesn’t always mark a price low. Besides, now prices are consolidating it allows time for RSI to recalibrate. And whilst resistance levels hold, bears aren’t likely to flee.
- The daily trend remains bearish below 300, although the zone around the broken trendline and 275.79 – 282.66 makes a tempting area for bears to fade into.
- For fading (shorting into a rising market, in this case) we’d want volatility to remain low. Keep in mind that without news to knock this lower, patterns such as dead cat bounces can go on for some time as they slowly grind higher. So, an earlier entry may require a wider stop.
- Alternatively, bears could wait for bearish momentum to return before assuming the dead cat bounce has completed, then use the 230 low as an initial target.
Related tags:
Latest market news



The complete CFD trading experience
Award-winning platforms, competitive spreads, low commissions and dedicated support.
We live and breathe the markets and are dedicated to helping traders realise their ambitions as we continue to set the industry bar.
Economic calendar
Web Trader platform
Our sophisticated web-based platform is packed with features.
Related articles

Nikkei threatens breakout as tech rebound broadens
Breakouts across the SOX and Nasdaq are being matched by rebounds across Asia, with the Nikkei now threatening to join the move.


S&P 500, Nasdaq 100 Forecast for the Week Ahead
A hawkish Fed and 10-Year Notes on the verge of a push above 5%, yet stocks have so far shrugged off that fear. But can it continue?

Hang Seng Tech rout nears make-or-break zone
The technical damage is clear, but with Hang Seng Tech now deeply stretched and approaching major support, the risk-reward is becoming more two-sided.
StoneX Europe Ltd may make third party material available on this website which may contain information included but not limited to the conditions of financial markets. The material is for information purposes only and does not contain, and should not be construed as containing, investment advice and/or investment recommendation and/or an investment research and/or an offer of or solicitation for any transactions in financial instruments; any decision to enter into a specific transaction shall be made by the client following an assessment by him/her of their situation.
StoneX Europe Ltd makes no representation or warranty and assumes no liability as to the accuracy or completeness of the information provided, nor any loss arising from any investment based on a recommendation, forecast or other information supplied. You should always seek independent advice as to your suitability to speculate in any related markets and your ability to assume the associated risks, if you are at all unsure. We are not under any obligation to update any such material. Any opinion made may be personal to the author and may not reflect the opinion of StoneX Europe Ltd.