














Japanese candlestick patterns cheat sheet FX
Explore 22 key Japanese candlestick patterns here – including bullish, bearish, reversal and continuation patterns. Plus, how to trade using candlesticks, and more.
Share this:

Banks
US banks are in focus today, with the likes of Morgan Stanley, JPMorgan Chase and Goldman Sachs all trading higher in pre-market trading after raising their dividends yesterday.
It comes after they raised their dividends after the Federal Reserve gave them a clean bill of health and loosened restrictions on payouts to shareholders. This saw Morgan Stanley announce it would double its quarterly payout to 70 cents per share and raise its buyback to as much as $12 billion from $10 billion.
Meanwhile, Goldman Sachs raised its dividend to $2 from $1.25, JPMorgan upped its payout to $1 from $0.90, and Bank of America raised its dividend to $0.21 from $0.18. In total, 13 banks increased their payouts and buybacks yesterday, which should funnel an extra $2 billion into shareholder hands in the third quarter of 2021.
Consumer confidence, due to be released at 1000 ET, will also be closely watched. It is expected to rise to 119 this month after steadying in May.
There was positive news for Facebook today after the company joined the $1 trillion club as shares hit a new all-time high on Monday.
A US judge has dismissed two antitrust lawsuits filed by the Federal Trade Commission and a coalition of states. The judge dismissed one because it was ‘legally insufficient’ and failed to prove Facebook has a monopoly in the social media market, and the other because the allegations were about incidents that took place too long ago.
Meanwhile, EU antitrust regulators will make a decision on whether to approve Facebook’s acquisition of Kustomer by August 2, filings have revealed. It was reported that Facebook had agreed to buy Kustomer last November for around $1 billion. Kustomer is a customer service unit that tries to bring all customer interaction under one platform. The EU has been closely watching acquisitions being made by Big Tech following allegations that they use them as a way to squash potential rivals.
FactSet
Financial information provider FactSet reported third-quarter results broadly in-line with expectations earlier today.
FactSet reported EPS of $2.72 per share in the third quarter, just below what analysts had expected, while revenue hit targets. FactSet said it expects EPS to come in between $10.75 to $11.15 for the full year, which was raised from its previous target of $10.05 to $10.45 but disappointing considering Wall Street had forecast $11.14.
FactSet raised its quarterly dividend by 6.5% to $0.82, marking the 22nd consecutive quarter of dividend growth.
Herman Miller
Furniture maker Herman Miller yesterday said it beat expectations in the final quarter of its financial year as orders for its retail segment more than doubled and its contract business started to recover.
Sales in the three months to May 29 rose to $621.5 million from $475.7 million the year before. Net earnings of $7.4 million compared favourably to the $173.7 million loss booked the year before. Adjusted EPS jumped to $0.56 from $0.11, which was well ahead of the $0.39 forecast by Wall Street.
Herman Miller said it is expecting to report 4.5% revenue growth in the first quarter of its new financial year and plans to deliver adjusted EPS of between $0.52 to $0.58.
United Airlines and Boeing
United Airlines confirmed reports that surfaced yesterday by confirming it has made an order for 270 new aircraft from Boeing and Airbus to replace older and smaller regional jets and larger aircraft.
The airline has ordered 200 Boeing 737 MAX planes and 70 Airbus A321neos. It also announced plans to refit all of its other narrow-body fleet to introduce a new ‘signature interior’ and other features such as better Wi-Fi and more storage for baggage. Combined with other orders, it means United Airlines will be introducing 500 new aircraft going forward – 40 in 2022, 138 in 2023, and as many as 350 in 2024 and beyond.
The new aircraft will be 11% more fuel efficient than its existing fleet and have 17% to 20% fewer carbon emissions. The main attraction is that these new planes are larger and should boost domestic capacity, which has traditionally lagged its rivals, by around 30%.
Walmart
Walmart has launched a new version of analog insulin that will be significantly cheaper than existing options on the market as it looks to build momentum in its healthcare business.
ReliOn NovoLog will be used to help people control high blood sugar levels in those with diabetes, which around 10% of the US population is thought to have. It is expected to be priced at around $73 a vial and $86 for a package including insulin pens. Branded vials can cost well over $100 and some insulin pens can cost as much as $250.
Johnson & Johnson
Johnson & Johnson is reported to have cancelled plans to conduct local trials of its coronavirus vaccine in India after the government said they were no longer necessary for jabs that have already been approved in other countries.
The news was reported by the Economic Times but has not been confirmed by J&J. The reports also suggested J&J was in talks with the government about how its single-shot jab can be delivered quicker.
Uber
Uber is expected to announce plans to allow its office staff to work up to half their hours remotely, according to reports from Reuters.
The announcement is expected to be made today. The new rule will be based on hours and not the number of days in the office, meaning they will be able to work a solid week in the office and then not come in at all the following week.
Didi
Chinese ride-hailing giant Didi is expected to price its upcoming blockbuster IPO at the top end of its price range, according to reports.
Reuters, citing unnamed sources, said Didi is to sell 288 million American Depositary Receipts at the top end of the $13 to $14 price range, suggesting it could raise up to $4.0 billion and earn an initial valuation of around $67.2 billion.
The final price is expected to be declared after US markets close today and shares should start trading this Wednesday.
How to trade top US stocks
You can trade a variety of stocks with Forex.com in just four steps:
- Open a Forex.com account, or log-in if you’re already a customer.
- Search for the company you want to trade in our award-winning platform
- Choose your position and size, and your stop and limit levels
- Place the trade
- What are Japanese candlestick patterns?
- Trading chart patterns
- Japanese candlestick patterns guide
- Basic candlestick patterns
- Bullish candlestick patterns
- Bearish candlestick patterns
What are Japanese candlestick patterns?
Japanese candlestick patterns are motifs that appear on trading charts. Technical traders believe that you can use them to predict future price action – which makes them useful for finding new potential opportunities.
In technical analysis, the only factor you consider when researching a market is its price chart. By looking at recent movements, you attempt to analyse current market sentiment and predict future behaviour.
Chart patterns offer one method of finding trades using technical analysis. Essentially, each pattern is a signal, which in the past has preceded a new trend, reversal or continuation. Once you spot a pattern on a chart, you can make a call about whether that price action will occur again.
If you think it will, you can open a new position and attempt to profit from the trade.
To learn more about Japanese candlesticks, take a look at our how to read charts guide.
How to trade chart patterns
To trade chart patterns with FOREX.com, follow these three steps:
- Open your FOREX.com account. Once approved, you can start trading within minutes
- Add some funds. You can add funds via debit card or bank transfer
- Log in and look for patterns on advanced TradingView charts
Not ready for live markets just yet? Open a demo account and access 12,000 live markets with zero risk.
Japanese candlestick patterns guide
| What does it look like? | No. of candlesticks | Bullish or bearish? | Reversal or continuation? |
| 1 | Neutral | Either | |
 Spinning top | 1 | Neutral | Either |
 Marubozu (Bearish)  Marubozu (Bullish) | 1 | Either | Continuation |
 Hammer | 1 | Bullish | Reversal |
 Inverse hammer | 1 | Bullish | Reversal |
 Hanging man | 1 | Bearish | Reversal |
 Shooting star | 1 | Bearish | Reversal |
 Bullish engulfing | 2 | Bullish | Reversal |
 Bearish engulfing | 2 | Bearish | Reversal |
 Piercing line | 2 | Bullish | Reversal |
 Dark cloud cover | 2 | Bearish | Reversal |
 Tweezer bottoms | 2 | Bullish | Reversal |
 Tweezer tops | 2 | Bearish | Reversal |
 Bullish harami | 2 | Bullish | Either |
 Bearish harami | 2 | Bearish | Either |
 Morning star | 3 | Bullish | Reversal |
 Evening star | 3 | Bearish | Reversal |
 Three white soldiers | 3 | Bullish | Reversal |
 Three black crows | 3 | Bearish | Reversal |
 Rising three methods | 3 | Bullish | Continuation |
 Falling three methods | 3 | Bearish | Continuation |
Basic candlestick patterns
Before we examine the key bearish and bullish chart patterns, let’s take a look at two that can crop up a lot, and often form the basis of larger moves: doji and spinning tops.
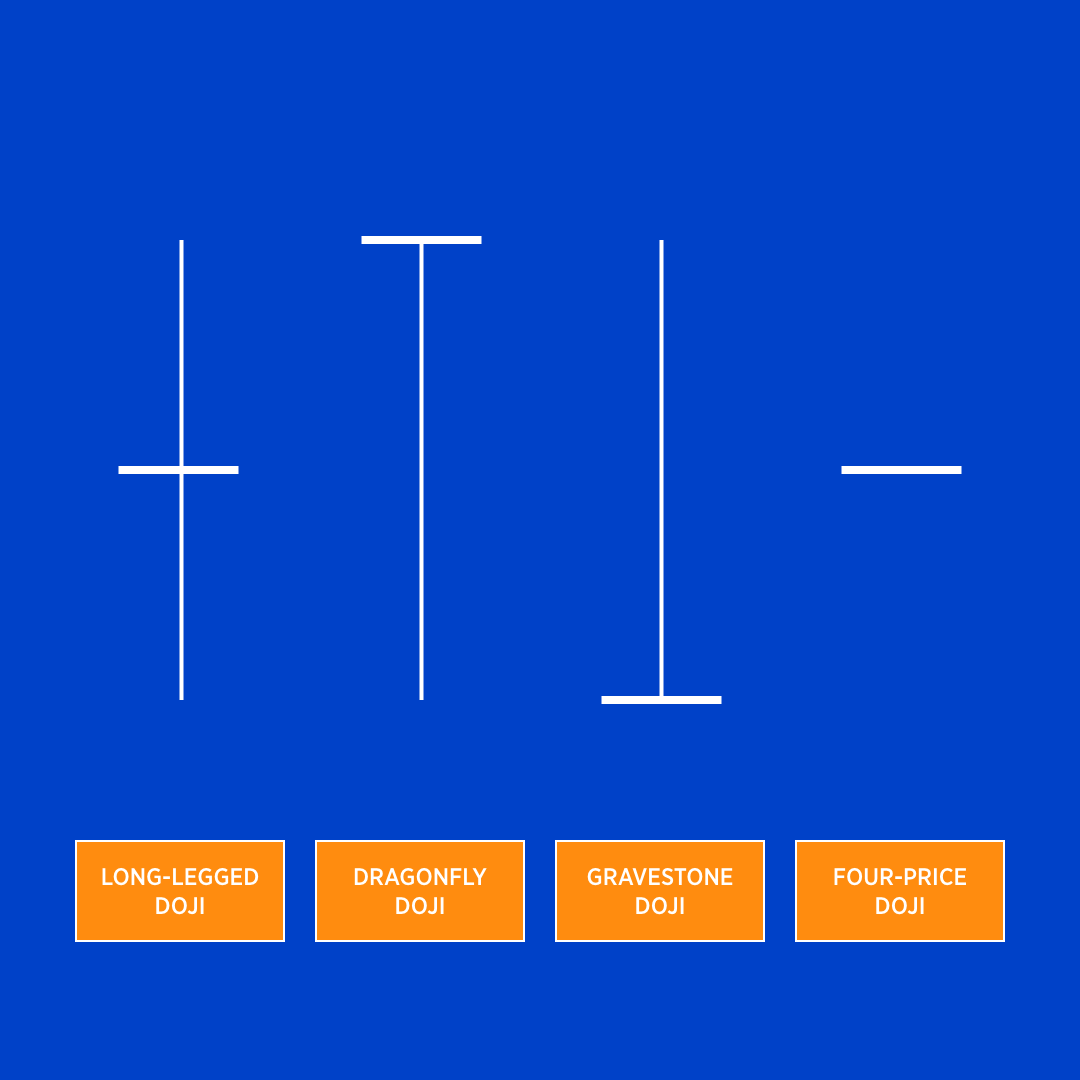
1. Doji
Doji occur when a market’s opening and closing price for the period is roughly (or exactly) the same. Whatever the price action within the period, by the end the buyers and sellers will have cancelled each other out.
To spot a doji, look for a candlestick with a very thin body: usually less than 5% of the total range in that period.
You can then look at the wick to determine what type of doji it is:
- If there is a long wick above the body, it's a gravestone doji
- If the wick extends beneath the body, it’s a dragonfly
- If the wick is long on both sides, it's a long-legged doji
- If there is no wick at all, it's a four-price doji
A doji on its own doesn't necessarily tell you much. But when taken in context, they can be useful.
Say, for example, that you spot a gravestone forming during an uptrend. The tall upper wick indicates that the bull run may have continued at the outset, but the thin body means that sellers took over before the session's end. A reversal could be on the cards.
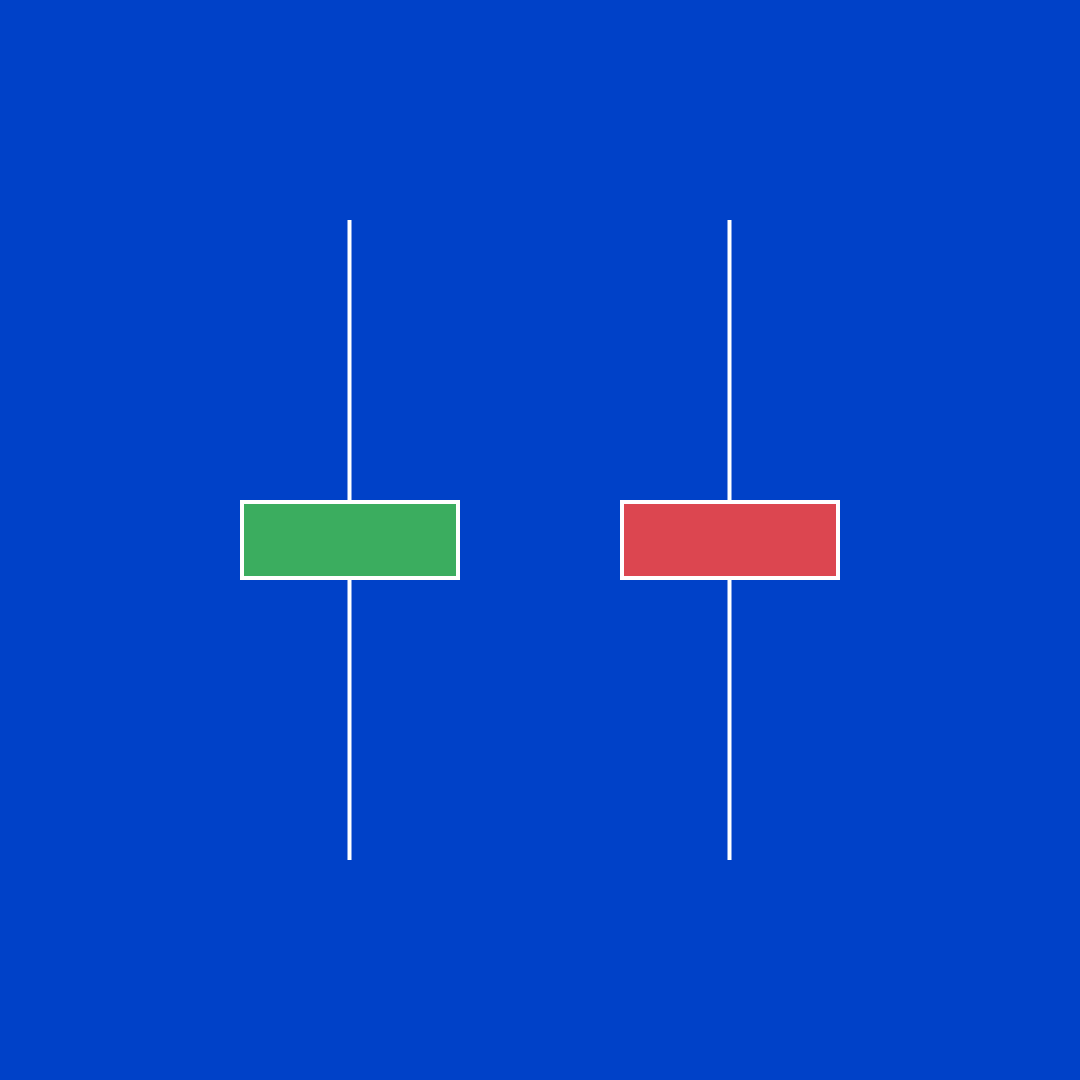
2. Spinning tops
A spinning top looks a lot like a long-legged doji but with a slightly wider body.
Here, the long upper and lower wicks tell you that the market saw significant volatility in the session. Buyers sent the market up; sellers sent it down. But in the end, neither had the upper hand.
The colour of the stick doesn't matter – all you need to look for is the long wick and shorter body.
A spinning top is often a sign that an existing trend is showing signs of petering out. In a long downtrend, for instance, sellers might have near-total control of a market. In a spinning top, that control has weakened significantly.
Bullish candlestick patterns
Bullish candlestick patterns signal that a market is about to make an upward move. They come in two main variations: reversal patterns, and continuation patterns.
A reversal pattern indicates that a market in a downtrend might be about to bounce back into an uptrend. Continuation patterns, meanwhile, occur during uptrends and can act as a sign that momentum isn’t slowing just yet.
When trading any candlestick pattern, it’s always a good idea to look for confirmation before opening your position. Patterns are no guarantee of future behaviour, so waiting for confirmation can help reduce the risk of losing out when a trend or continuation fails.
There are a few different ways of confirming before trading. you could, for instance, wait for the resulting trend or continuation to start before jumping in. Alternatively, you could look at a shorter-term chart to take a closer look at current price action.
Bullish candlestick reversal patterns
Technical traders use bullish reversal patterns to try and predict when a downtrend might end and a rally might start. They tend to appear in two places: at the bottom of a downtrend, or in a period of consolidation shortly after a downtrend.
As ever, you’ll want to confirm the pattern before you trade it. A simple confirmation is to see if a rally starts to form. That could be in the form of a bullish green candlestick, or the market breaking through a resistance level.
Let’s explore some of the main bullish reversal patterns.
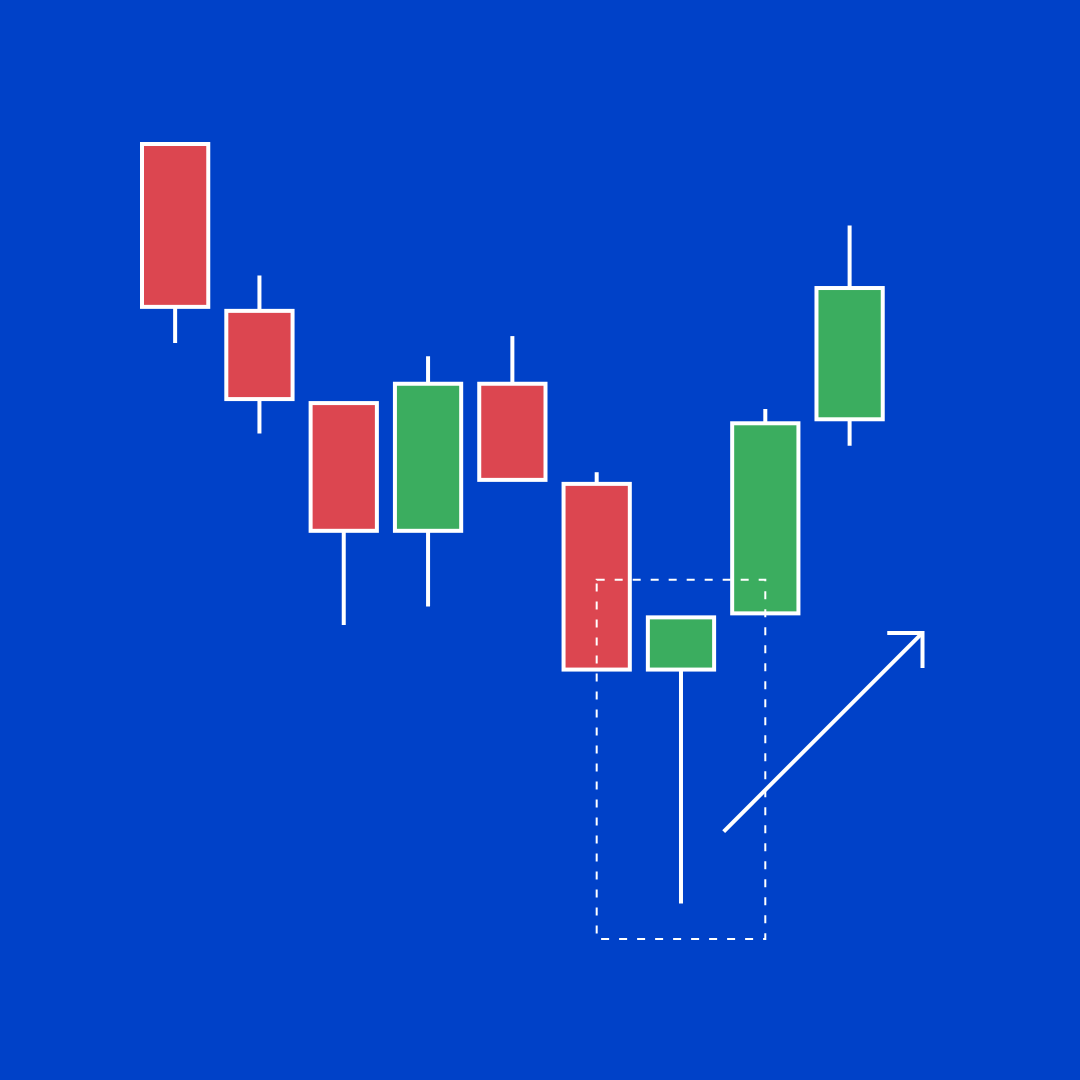
1. Hammer
A hammer is a single candlestick pattern that consists of a short body with a long lower wick, and little to no upper wick. It’s seen as a sign of an impending bullish reversal – which means that if you spot one during a downtrend, the market might be about to bounce back up.
Why? Because sellers pushed its price down to new lows during the session but couldn’t keep it there. Instead, buyers fought back, and the market ended up close to its opening price.
- If a hammer is red, then the market closed a little below its opening price
- If it is green, then it closed above its opening price – meaning the signal is seen as stronger
To find a hammer, look at the length of the body compared to the wick. The wick should be two or three times longer than the body.
2. Inverse hammer
An inverse hammer is a hammer that looks upside down: short body, long upper wick, little to no lower wick.
As the name suggests, the price action within is the inverse of what happens in hammer. Bulls initially took over in the session, sending the market up after a downtrend. But the reversal didn’t take hold, and bears ensured that its price ended up roughly where it started.
However, the sellers couldn’t resume the downtrend – a sign that momentum may be about to change.
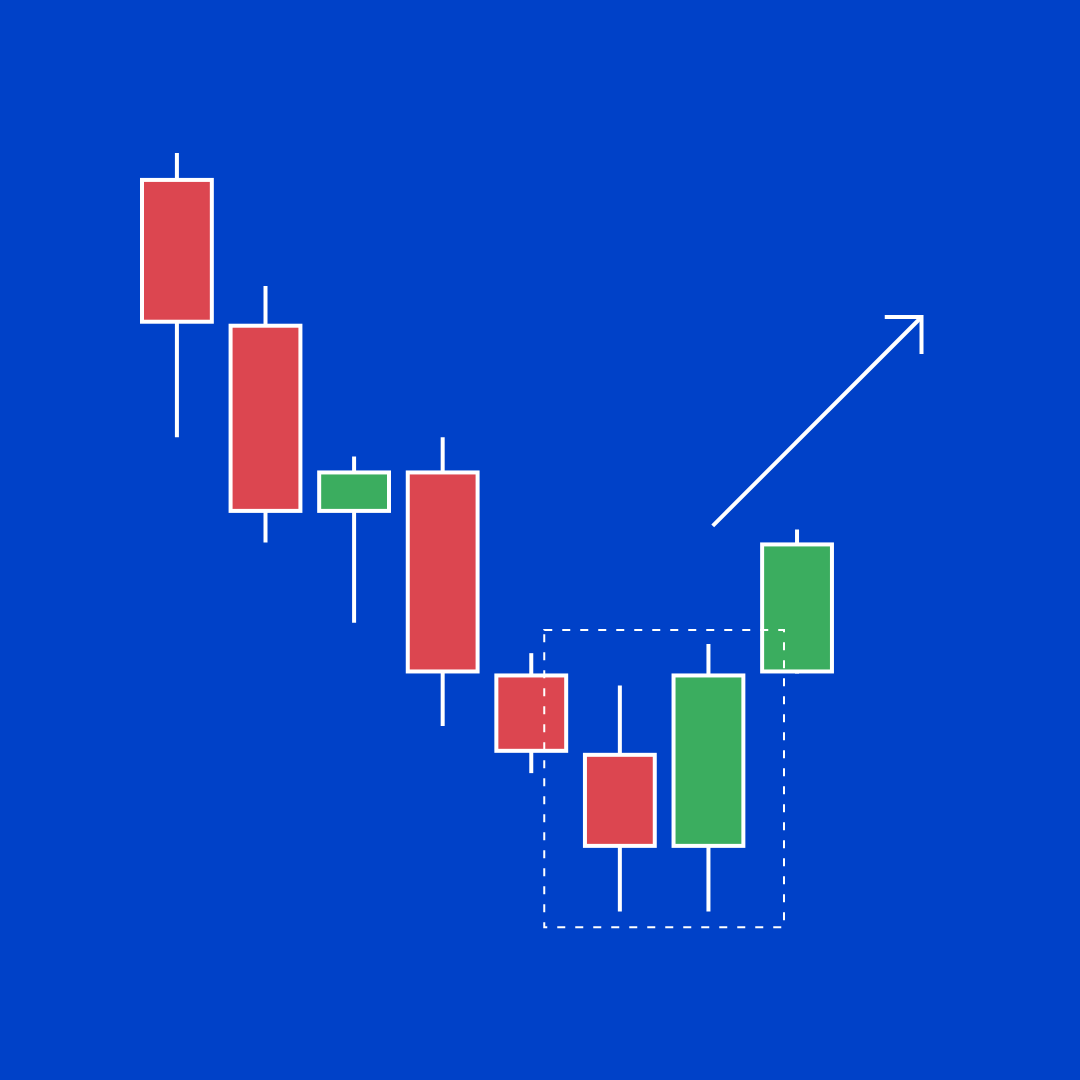
3. Bullish engulfing
A bullish engulfing pattern takes place over two candles.
The first is red, appearing as part of a downtrend (or consolidation after a downtrend). The red candle is followed by a green one that entirely engulfs it, meaning that the market opened lower but then sailed past the previous period’s high.
Despite the poor start to the session – as the market opens below the previous close – the second candle in a bullish engulfing demonstrates strong upward momentum. There should be little visible upper or lower wick, as the market finishes at or near the period’s peak and barely drops below the low open.
Technical traders believe that this renewed buying sentiment should turn into a new upward trend.
4. Piercing line
Like the bullish engulfing, a piercing line is formed of two candlesticks that signal a positive market reversal. The first is red, and the second is green.
However, in a piercing line the red candlestick has a long body and isn’t engulfed by the following one. Instead, the market usually gaps down between the red’s close and the green’s open, but then rallies beyond the mid-price of the previous session (the ‘piercing line’).
We’re still witnessing a market reversal. But this time, the bears had total control of the market until part way through the second session, when bulls instigated a rally.
5. Tweezer bottoms
Tweezer bottoms consist of two candlestick that appear identical, except the first is red and the second is green. Both should ideally have a short body and a longer lower wick.
The two equal lower wicks indicate that sellers tried to drive the price lower in each session. But both times, they were driven back by buyers. In the second session, buyers then sent the price above the open, as bullish sentiment overtook the bears.
Tweezer bottoms are easy to spot, as they look like a pair of tweezers. However, they don’t appear as often as some of the other patterns covered here.
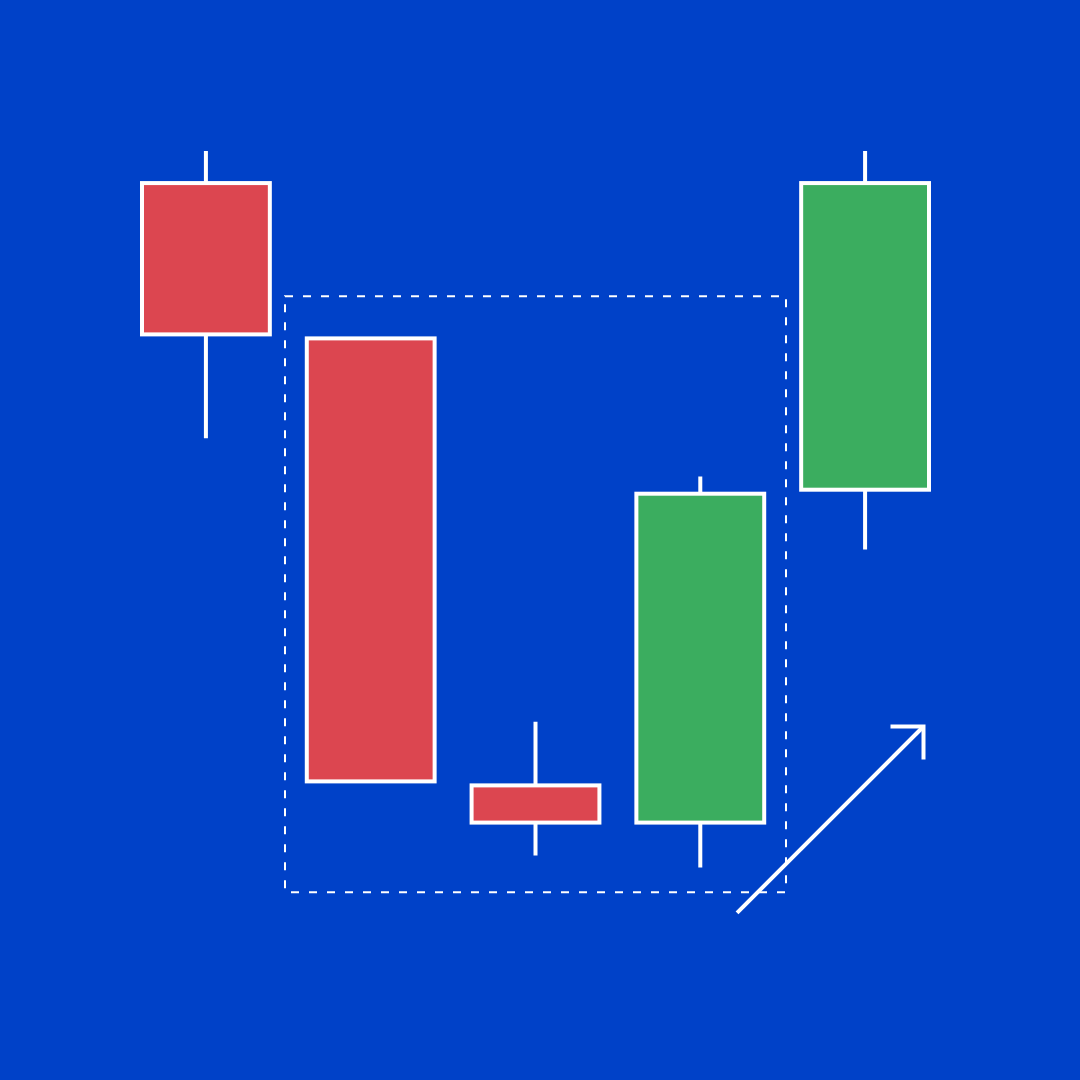
6. Morning star
In a morning star, three candles demonstrate a fairly clear shift in sentiment.
- The first, a long red stick, shows that a bear trend is continuing
- The second has a short body – indecision is undermining the trend
- The third is a long green stick, as a reversal forms
The key candle here is the one right in the middle. Typically a spinning top, this is an indication that the downward trend is coming to an end. If the middle candle is a doji, then the signal is seen as even stronger.
To verify that you’ve got a morning star, check that the third candlestick crosses the mid-price of the first.
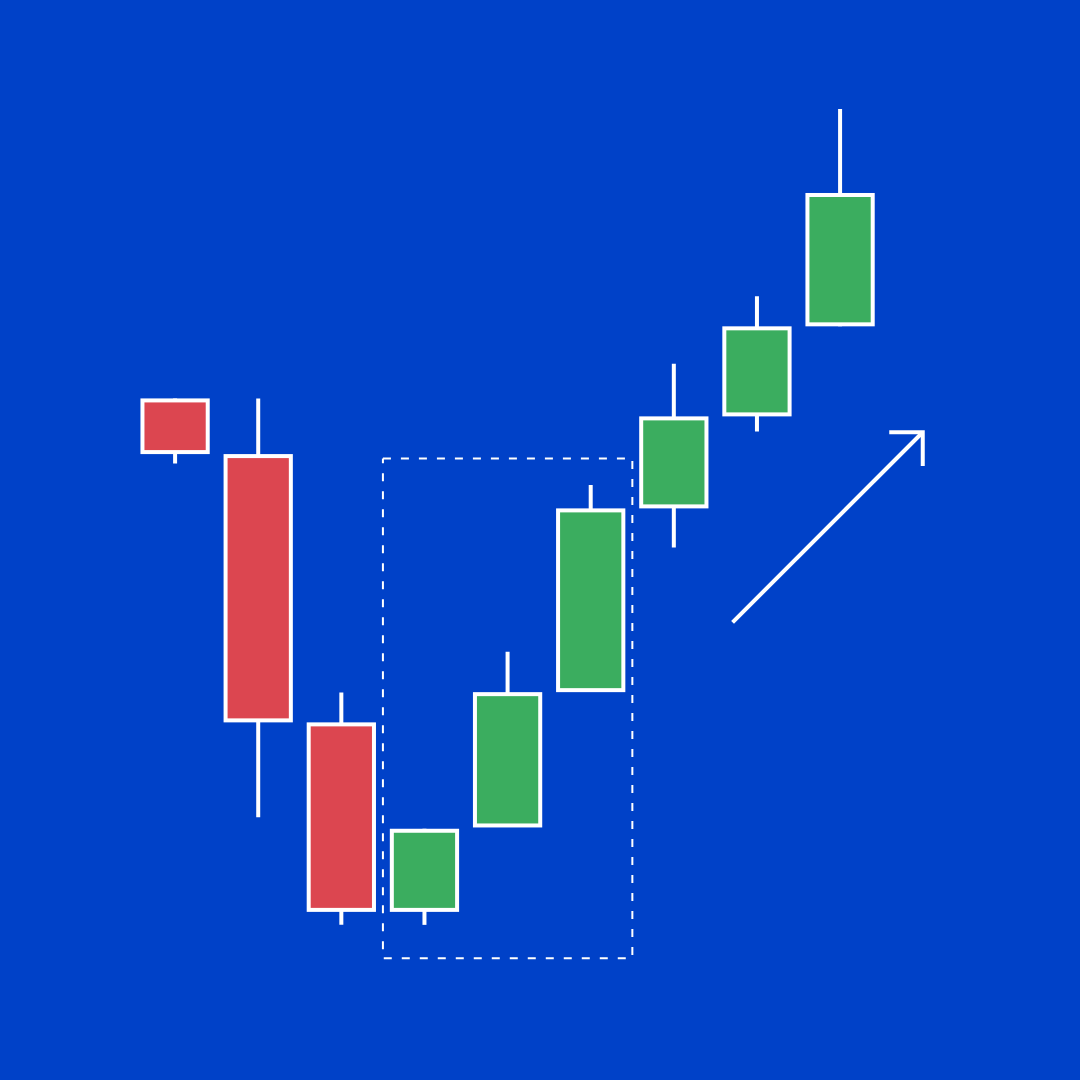
7. Three white soldiers
The three white soldiers pattern appears after a sharp downtrend. Technical traders believe that it offers one of the strongest indications that a reversal has occurred.
It consists of three green candlesticks that follow a long red session. The first should close at around 50% of the previous candle’s range. The second should close above the open of the red session. The third is a long green stick, signalling that an uptrend is now well under way.
Each of the ‘soldiers’ should have a longer body that the last, as buying momentum builds.
Bullish continuation patterns
Bullish continuation patterns are useful for checking whether an existing uptrend still has momentum.
Say, for example, that you want to buy a rallying EUR/USD, but you’re worried that it might retrace. A continuation pattern is a signal that the trend isn’t over yet.
Here are a few useful examples.
1. Bullish marubozu candlestick
The simplest sign that a pattern is in rude health is a green marubozu stick.
Marubozu are easy to spot. They have zero wick on either side, as the session opened at its lowest point and closest at its peak. This is where the pattern gets its name – marubozu is Japanese for ‘bald’.
In a green marubozu, bulls had almost total control. The longer the body, the more control they had.
2. Bullish harami
A bullish harami is formed of two candles:
- A long red stick
- A short green stick that is completely contained within the previous one
If you spot one during a downtrend, it may signal a reversal. But during uptrends, they’re taken as a continuation pattern.
In a harami, the strong selling sentiment indicated by the first candle gives way, allowing buyers into the market. Those buyers are unable to send its price higher, but do arrest the fall. As bullish momentum builds, an uptrend may resume or form.
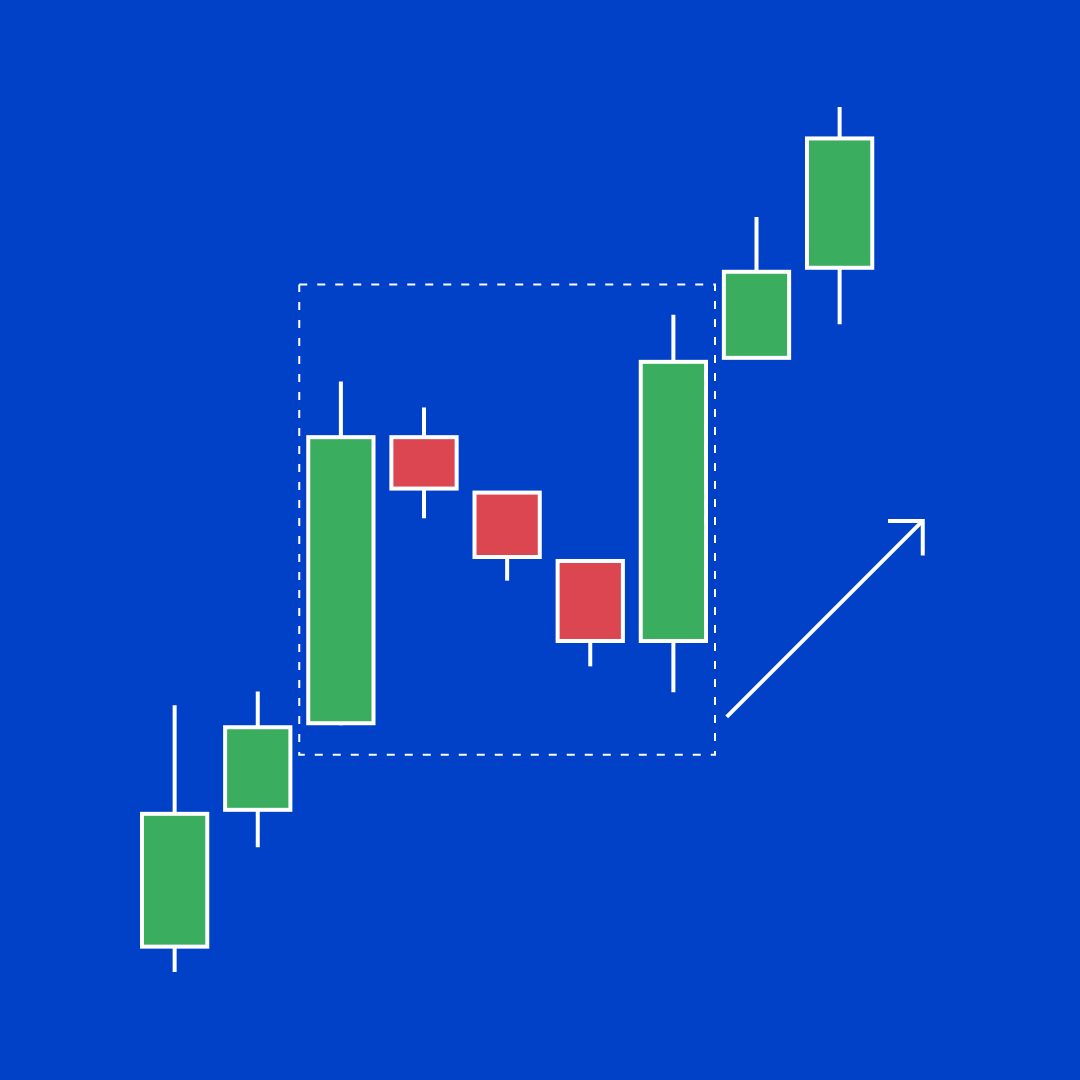
3. Rising three methods
The rising three methods is a little bit more complex, consisting of five candlesticks that can look like a reversal at first sight.
In the rising three methods, a long green stick is followed by three smaller red ones. The three red sessions must all fall within the open and close range of the first candle. Then, a final green candlestick takes the market back above the first candle’s close.
While sellers took control of three straight sessions, the momentum is weak, failing to offset the gains made in the first period. When buyers re-enter the market, they easily overpower the sellers – resuming the original bull run.
Bearish candlestick patterns
Bearish patterns signal an impending downward move.
As with their bullish counterparts, they come in two types: reversal and continuation patterns. This time, though, a reversal signals the end of a rally and the beginning of a downtrend. Continuation patterns, on the other hand, can hint that an existing bear run isn’t over yet.
Remember to wait for confirmation before trading a bearish pattern. A simple method of confirming a bear move is to look for a strong red candle immediately after the pattern, or hold off until the market has broken through a key area of support.
Bearish reversal patterns
One useful aspect of candlestick patterns is that they usually have an exact opposite. An upside-down version of a bullish reversal pattern will usually indicate a bearish reversal, and vice versa.
Let’s take a look at the bearish counterparts of some of the bullish patterns covered above.
1. Hanging man
A hanging man looks exactly like a hammer but appears at the end of an uptrend. Like the hammer, it signals an impending reversal – however, this time, a bull run may be about to retrace into a bear market.
Sellers took the asset’s price down in the session, before being beaten back by buyers. But those buyers couldn’t resume the rally, indicating that momentum may be about to shift.
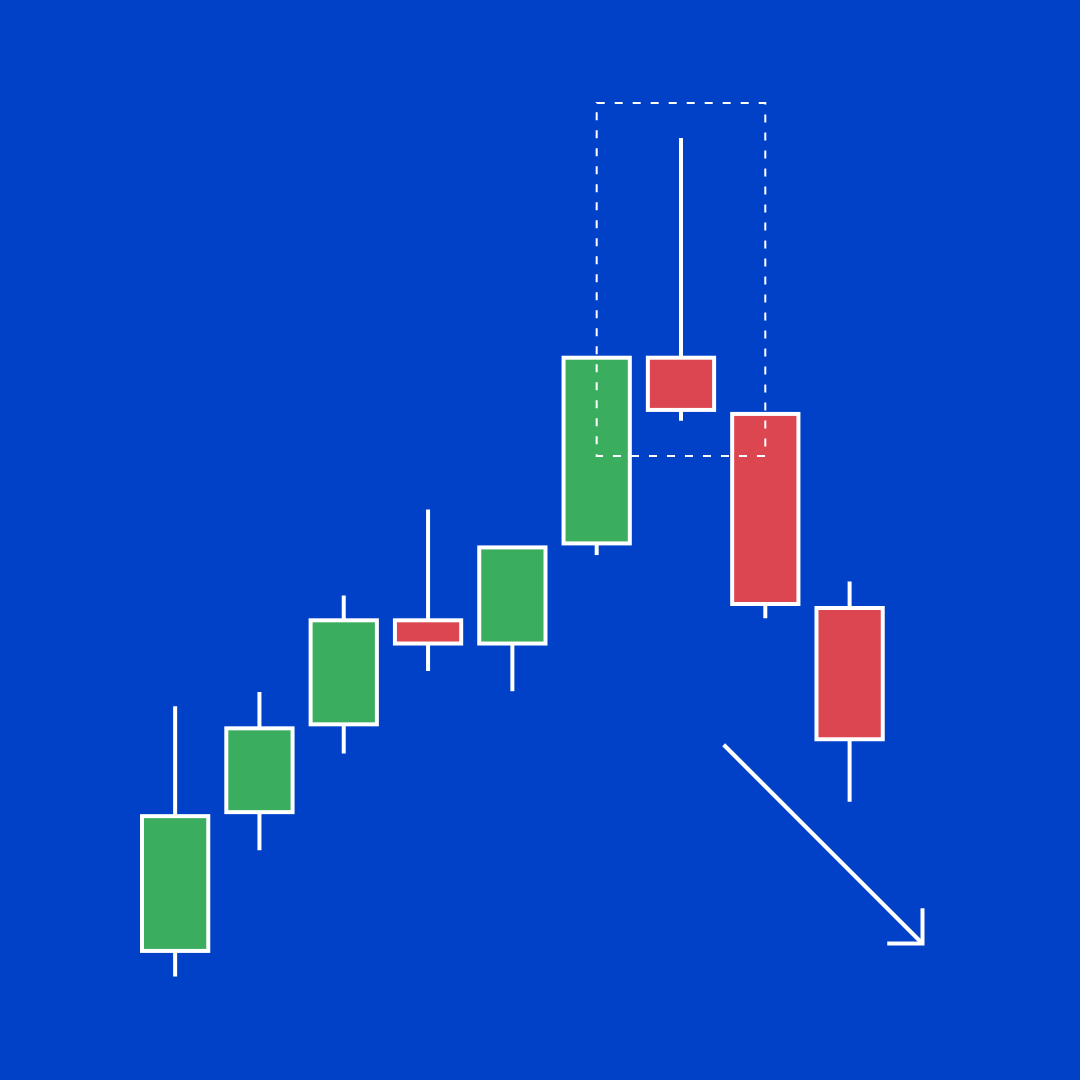
2. Shooting star
What about if we spot an inverse hammer during an uptrend?
This is called a shooting star, and it’s another signal of a potential bullish reversal. The price action is the same as in an inverse hammer, with an early continuation of the rally being beaten back by sellers. Since this is occurring at the top of an uptrend, a reversal may follow.
As ever, you may want to consider waiting for further red candles to confirm the new move before opening your trade.
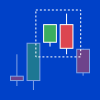
3. Bearish engulfing
A bearish engulfing consists of a green candle followed immediately by a red one – with the second completely dwarfing its predecessor.
The second session brought a swift change of tide, initially opening higher but quickly falling as bears take over. As more and more sellers pile into the market, supply rises and demand falls – marking the beginning of a possible new downtrend.
As with a bullish engulfing, look for a second candle that has little or no wick on either end.
4. Tweezer tops
In the tweezer tops pattern, two identical candlesticks (except that the first is green and the second is red) appear at the top of an uptrend. Ideally, both have short bodies with longer upper wicks.
Buyers have twice attempted to push the market to new highs but have failed both times. The second time, the market then fell back to the first period’s open. This piece of symmetry is a clue that momentum is on the wane, with a possible bear run imminent.
You might spot tweezer tops in market that isn’t currently trending. They’re still considered a bearish signal, but not as strong as during an uptrend.
5. Dark cloud cover
Similar to the piercing line, the dark cloud cover pattern arises over two sessions.
In the first, a green candle indicates bullish momentum. The next red candlestick then opens above the close of its predecessor, before tumbling down beyond its mid-price. The optimism of the previous period has been dashed, hence the ‘dark cloud’ of the name.
The shorter the wicks on the second candle, the stronger the signal.
6. Evening star
An evening star, meanwhile, is the opposite of the morning star.
This time, only the first and third candles are different. The middle candlestick is still a spinning top or doji of either colour. But the first candle is green and the final one is red.
The market rally continues in the first session, before indecision sets in during the second. By the third, a retracement is underway as more and more traders close their long positions – and sellers open short ones.
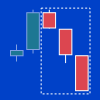
7. Three black crows
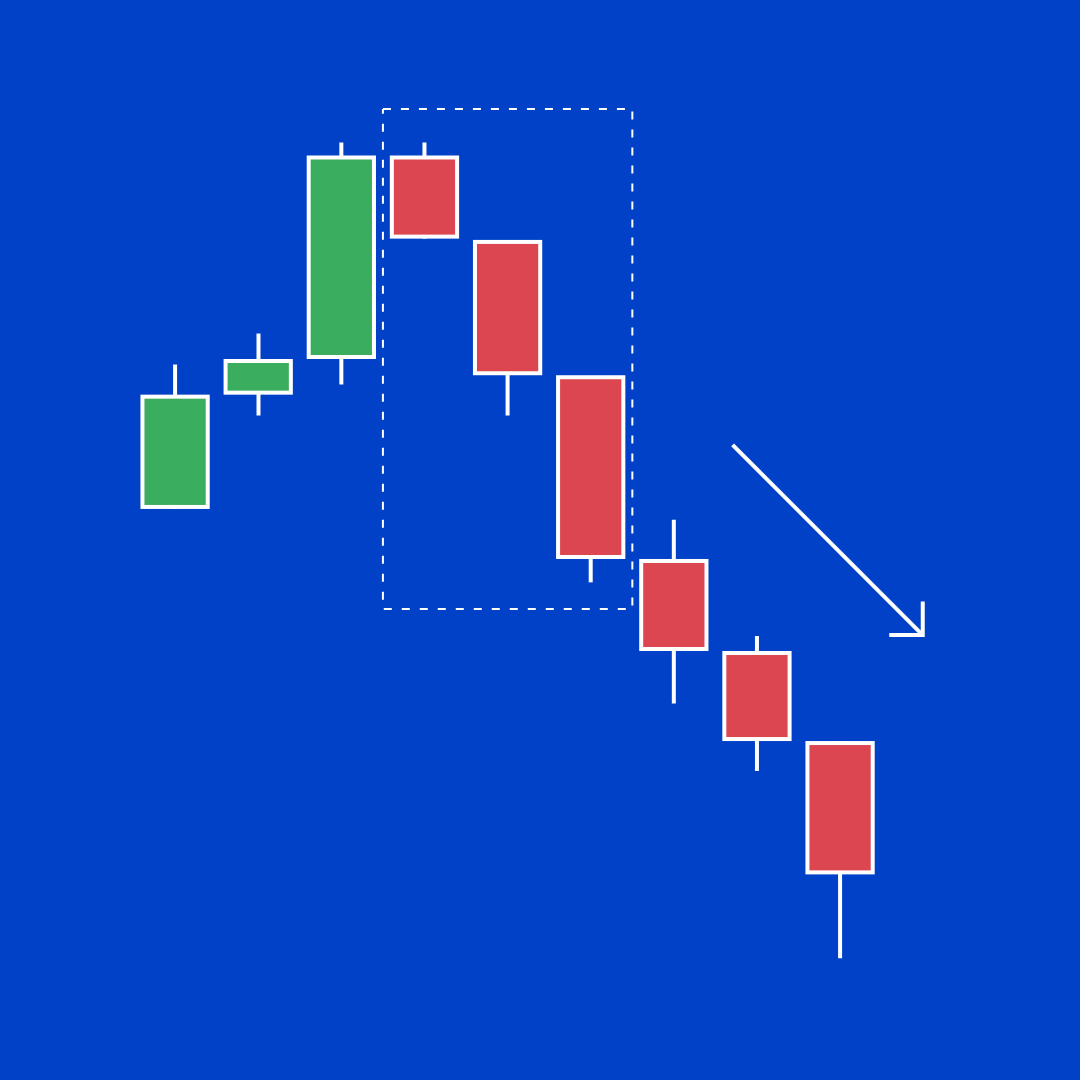
The three black crows is the bearish counterpart of the three white soldiers. The rules are the exact opposite of the bullish version, with three red candles following a long green one.
Remember that:
- The first red candle should close at around 50% of the green one
- The second should close below the green candle’s open
- Each red body should be longer than the last
If any of these criteria aren’t met, then it probably isn’t a three black crows pattern.
Bearish continuation patterns
The final set of patterns we’re going to cover signal bearish continuations. Again, these are the exact opposite of the three bullish variants we’ve already seen.
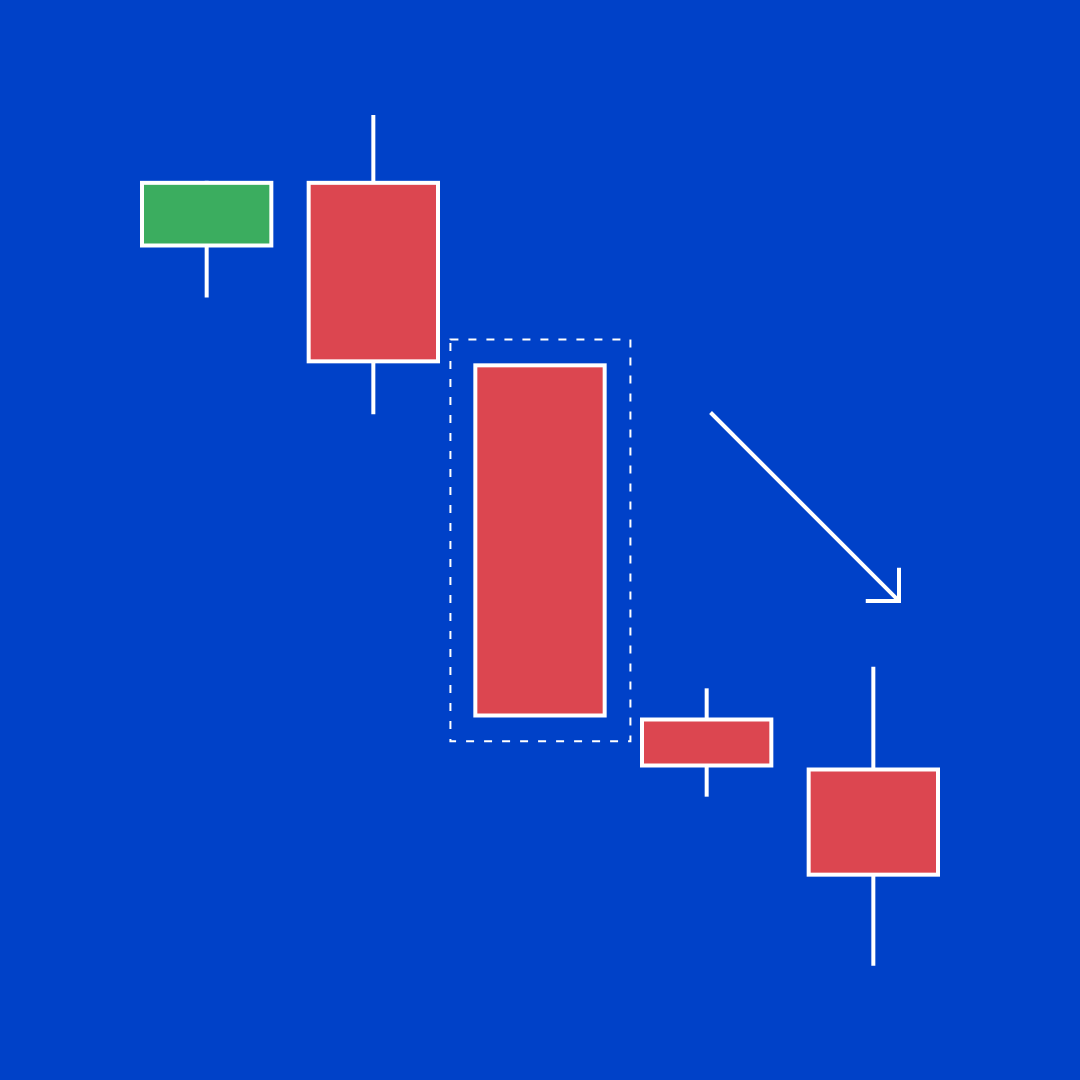
1. Bearish marubozu
The bearish marubozu is a red candle with no wick whatsoever. The opening price was the market’s highest point during the session, and it ended at its lowest point.
During a downtrend, red marubozu are a solid sign of strong downward momentum.
2. Bearish harami
In a bearish harami, a long green session is followed by a smaller red one. The red candle is entirely within the open and close of the first period.
In the second candle, bulls and bears tussled for control of the market. Buyers attempted to continue the momentum from the first session, but couldn’t. Instead, sellers pushed price back down – but couldn’t move it much.
Like its bullish counterpart, a bearish harami is often taken as a signal of an impending downward move. If one arises during an existing downtrend, it indicates a continuation. On an uptrend, it indicates a reversal.
3. Falling three methods
The falling three methods is made up of five candlesticks:
- A long red session as part of a downtrend
- Three smaller green candles that all fall within the range of the first session
- Another long red session as the downtrend resumes
Essentially, the sellers are stepping back before pushing the market back down once more. This allows buyers to control three sessions, but they’re unable to muster enough momentum to break the first candle’s opening price.
Want to learn more about technical analysis? Discover in-depth lessons in the FOREX.com Trading Academy.
Candlestick patterns FAQs
Which candlestick pattern is the most reliable?
There’s no single candlestick pattern that stands out as the most reliable – but some are thought to predict price action more consistently than others. Of the patterns covered here, the three white soldiers and three black crows are often considered the most reliable.
It isn’t hard to see why – with both patterns, the resulting move is well underway by the time the pattern completes.
Learn how to trade the three white soldiers here.
Do candlestick patterns work?
Candlestick patterns do work – just not all of the time. Some are more reliable than others, but whichever pattern you choose to trade, you should always confirm the move and use a stop loss. This helps reduce your risk if the pattern fails.
How many different candlestick patterns are there?
We’ve covered 22 candlestick patterns here, but there are many many more that aren’t included. Different technical traders use different patterns, and more are added new examples all the time. If you’re just starting out, though, it might be best to focus on a few standard patterns and build from there.
One useful tip: use a demo account to practise trading new potential patterns before you commit real capital. That way, you can decide which work best for you.
How are candlestick patterns used in day trading?
Candlestick patterns are used in day trading in pretty much exactly the same way as anywhere else – spot a pattern form on a market, confirm the resulting move and open your trade. Day traders will tend to use shorter-term charts to spot opportunities, but otherwise the principle is the same.
Related tags:
Latest market news




The complete CFD trading experience
Award-winning platforms, competitive spreads, low commissions and dedicated support.
We live and breathe the markets and are dedicated to helping traders realise their ambitions as we continue to set the industry bar.
Economic calendar
Web Trader platform
Our sophisticated web-based platform is packed with features.
Related articles
S&P 500, Nasdaq, Dow Forecast: Wall Street Split Widens Into Month-End 9 26 2026
Nasdaq strength contrasts with mounting Dow pressure as rising Treasury yields raise the stakes for stocks heading into the monthly close.
EUR/USD weekly outlook: Oil, inflation and NFP in focus
After coming under significant pressure in recent weeks, the EUR/USD came off its lows to finish the week on a positive note on Friday, albeit with only a mild rebound. That was not enough to prevent the exchange rate falling for the third consecutive week, as the US dollar and bond yields rallied across the board.

Gold Q4 2026 outlook: Resilience in the face of rallying dollar and yields
As we headed towards the latter stages of Q3 and into Q4, the Fed had just hiked rates in a hawkish FOMC meeting, while the likes of the ECB and BoJ had also tightened their respective policies. Oil prices remained elevated amid the prolonged US-Iran conflict. Meanwhile, bond yields were breaking out, and the dollar was higher across the board. Yet, remarkably, gold was still holding in the positive territory for the third quarter, even if it had weakened somewhat in September.
StoneX Europe Ltd may make third party material available on this website which may contain information included but not limited to the conditions of financial markets. The material is for information purposes only and does not contain, and should not be construed as containing, investment advice and/or investment recommendation and/or an investment research and/or an offer of or solicitation for any transactions in financial instruments; any decision to enter into a specific transaction shall be made by the client following an assessment by him/her of their situation.
StoneX Europe Ltd makes no representation or warranty and assumes no liability as to the accuracy or completeness of the information provided, nor any loss arising from any investment based on a recommendation, forecast or other information supplied. You should always seek independent advice as to your suitability to speculate in any related markets and your ability to assume the associated risks, if you are at all unsure. We are not under any obligation to update any such material. Any opinion made may be personal to the author and may not reflect the opinion of StoneX Europe Ltd.