





Nasdaq 100 analysis: NDX retests key 12,900 level
A bullish bias remains appropriate with the Nasdaq 100 still above the key 12,900 level, but any more weakness would call that optimistic outlook into question
Share this:

Nasdaq 100 takeaways
- Last week’s big breakout in the Nasdaq 100 is facing its first major test
- The “Big 7” stocks that make up more than 50% of its weight are underperforming the broader index
- Bullish bias remains intact for now, but economic data will be key
Last week, we discussed the big breakout above 12,900 in the Nasdaq 100 and concluded that “only a reversal back below this week’s lows near 12,500 would erase the near-term bullish bias in the Nasdaq 100.”
Now, a week on, that bullish bias is facing its first big test.
The tech-heavy index rallied as high as 13,200 yesterday, but fears about a slowing US economy on the back of soft JOLTS, ADP, and ISM Services PMI figures have traders questioning whether instability in the banking system and the delayed impact of interest rate hikes over the last year could tip the economy into recession.
Even more than other indices, the Nasdaq 100 is very top-heavy, with the majority of the index’s weighting in just seven “Big Tech” names. As the chart below shows, outside of Alphabet (GOOG and GOOGL), all of these behemoths are underperforming the index’s -1.0% move today as we go to press:
Source: Slickcharts
Nasdaq 100 technical analysis: US TECH 100 daily chart
Source: StoneX, TradingView. Please note this product may not be available in all regions.
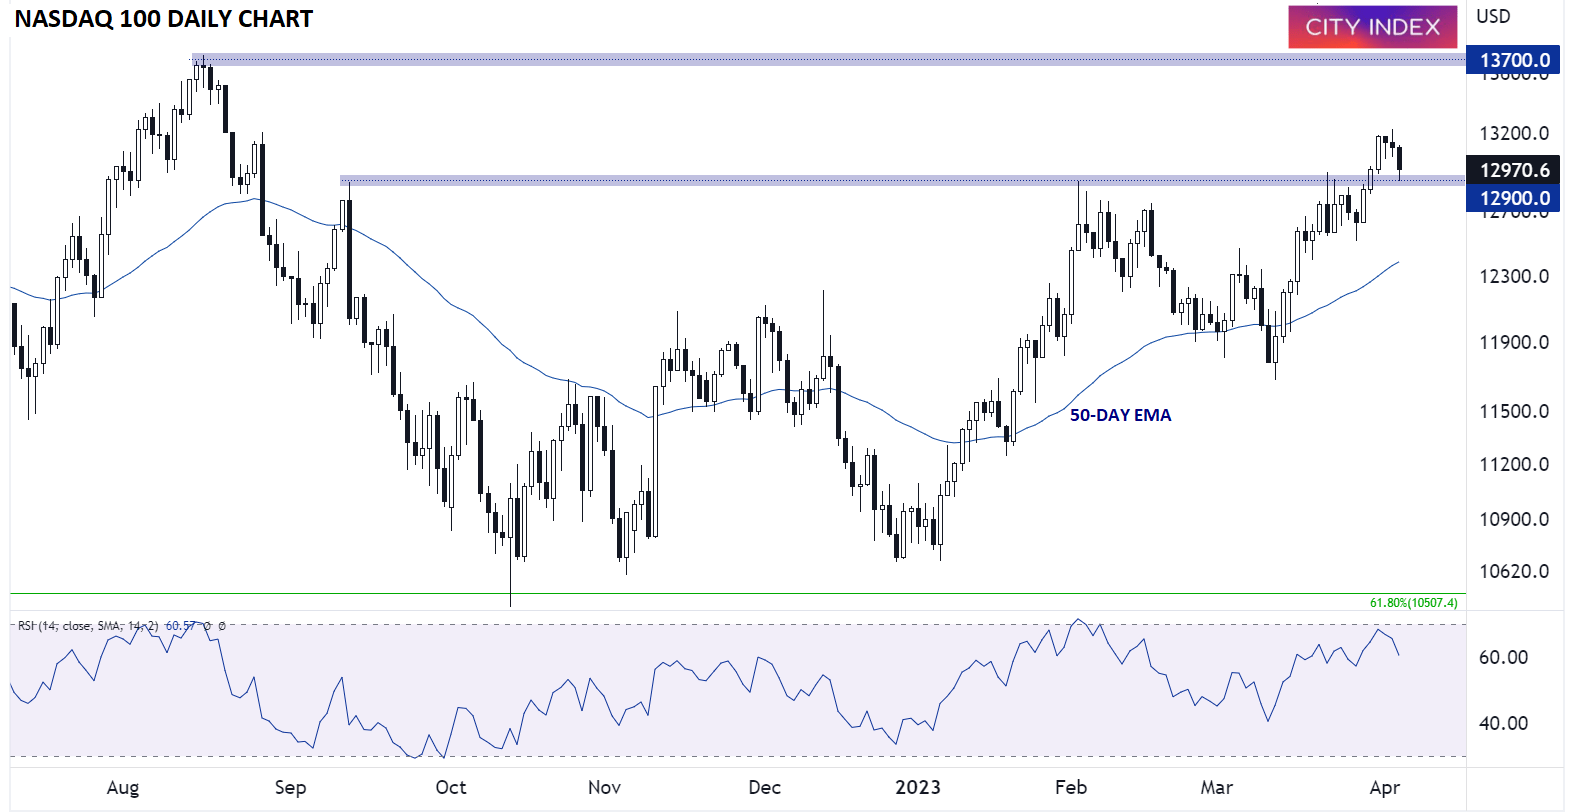
Looking at the chart above, the index has retraced back to the key 12,900 level. As many experienced traders know, breakouts have a tendency to revisit the proverbial “scene of the crime;” in other words, the Nasdaq 100 has retraced back to its initial breakout level, and it now remains to be seen if that previous resistance level will become support moving forward.
For now, a bullish bias remains appropriate with the index still above the key 12,900 level, but any more weakness, especially on the back of soft economic data in the coming days, would call that optimistic outlook into question.
-- Written by Matt Weller, Global Head of Research
Follow Matt on Twitter @MWellerFX
Nasdaq 100 takeaways
- Last week’s big breakout in the Nasdaq 100 is facing its first major test
- The “Big 7” stocks that make up more than 50% of its weight are underperforming the broader index
- Bullish bias remains intact for now, but economic data will be key
Last week, we discussed the big breakout above 12,900 in the Nasdaq 100 and concluded that “only a reversal back below this week’s lows near 12,500 would erase the near-term bullish bias in the Nasdaq 100.”
Now, a week on, that bullish bias is facing its first big test.
The tech-heavy index rallied as high as 13,200 yesterday, but fears about a slowing US economy on the back of soft JOLTS, ADP, and ISM Services PMI figures have traders questioning whether instability in the banking system and the delayed impact of interest rate hikes over the last year could tip the economy into recession.
Even more than other indices, the Nasdaq 100 is very top-heavy, with the majority of the index’s weighting in just seven “Big Tech” names. As the chart below shows, outside of Alphabet (GOOG and GOOGL), all of these behemoths are underperforming the index’s -1.0% move today as we go to press:
Source: Slickcharts
Nasdaq 100 technical analysis: US TECH 100 daily chart
Source: StoneX, TradingView. Please note this product may not be available in all regions.
Looking at the chart above, the index has retraced back to the key 12,900 level. As many experienced traders know, breakouts have a tendency to revisit the proverbial “scene of the crime;” in other words, the Nasdaq 100 has retraced back to its initial breakout level, and it now remains to be seen if that previous resistance level will become support moving forward.
For now, a bullish bias remains appropriate with the index still above the key 12,900 level, but any more weakness, especially on the back of soft economic data in the coming days, would call that optimistic outlook into question.
-- Written by Matt Weller, Global Head of Research
Follow Matt on Twitter @MWellerFX
How to trade with City Index
You can trade with City Index by following these four easy steps:
- Open an account, or log in if you’re already a customer
• Open an account in the UK
• Open an account in Australia
• Open an account in Singapore
- Search for the market you want to trade in our award-winning platform
- Choose your position and size, and your stop and limit levels
- Place the trade
Related tags:
Latest market news




The complete CFD trading experience
Award-winning platforms, competitive spreads, low commissions and dedicated support.
We live and breathe the markets and are dedicated to helping traders realise their ambitions as we continue to set the industry bar.
Economic calendar
Web Trader platform
Our sophisticated web-based platform is packed with features.
Related articles
Equity Indices Q4, 2026 Outlook: Cracks Begin to Show
There's still an open door for a melt-up in the S&P 500 and Nasdaq but the Dow and Russell 2000 are looking more vulnerable, and until calm hits the Treasuries market there's a higher probability for volatility. The big question is whether that's a next quarter theme or not.


S&P 500 forecast: Stocks extend drop as correction risks grow
US and global equity markets have extended Wednesday’s sell-off, with Wall Street opening lower after a weak handover from Asia and Europe. The deterioration in risk appetite has been spreading across global markets. The dollar was firmer, Treasury yields were holding onto yesterday’s gains, while gold, silver and bitcoin were all under pressure alongside equities and major currencies.


EUR/USD, Nasdaq Price Outlook: Reversal Risks Build
EUR/USD and Nasdaq Price Outlook: Overbought/oversold momentum on hourly and daily time frames is raising reversal risks across the U.S. dollar, EUR/USD and Nasdaq after a strong weekly advance.

StoneX Europe Ltd may make third party material available on this website which may contain information included but not limited to the conditions of financial markets. The material is for information purposes only and does not contain, and should not be construed as containing, investment advice and/or investment recommendation and/or an investment research and/or an offer of or solicitation for any transactions in financial instruments; any decision to enter into a specific transaction shall be made by the client following an assessment by him/her of their situation.
StoneX Europe Ltd makes no representation or warranty and assumes no liability as to the accuracy or completeness of the information provided, nor any loss arising from any investment based on a recommendation, forecast or other information supplied. You should always seek independent advice as to your suitability to speculate in any related markets and your ability to assume the associated risks, if you are at all unsure. We are not under any obligation to update any such material. Any opinion made may be personal to the author and may not reflect the opinion of StoneX Europe Ltd.