



Nasdaq 100 enters official correction with its 10% decline
The Nasdaq has officially entered corrective territory now it has fallen 10% from its record high. The question now is whether bears can now drive it below 15,000.
Share this:

There’s a saying in the stock markets that “tops are a process, bottoms are an event”. And this relates to the tendency that market tops can be a slow and grinding experience whilst bottoms can happen quickly. It’s not always the case, but we appear to be seeing that on US markets at the moment. Compare the March 2020 ‘V-bottom’ low to price action since the record high on the Nasdaq 100 and you’ll see what we mean.

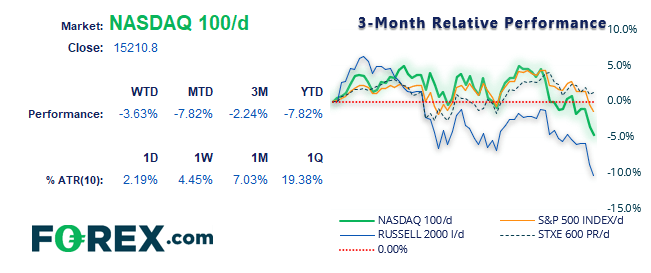
Price action has been choppy for the past couple of months, although bearish momentum is increasing as yields rise ahead of anticipated hikes form the Federal Reserve. So can prices accelerate lower from here? Quite possibly. But markets rarely move in a straight line and bear markets / deep corrections are notorious for countertrend whipsaws.

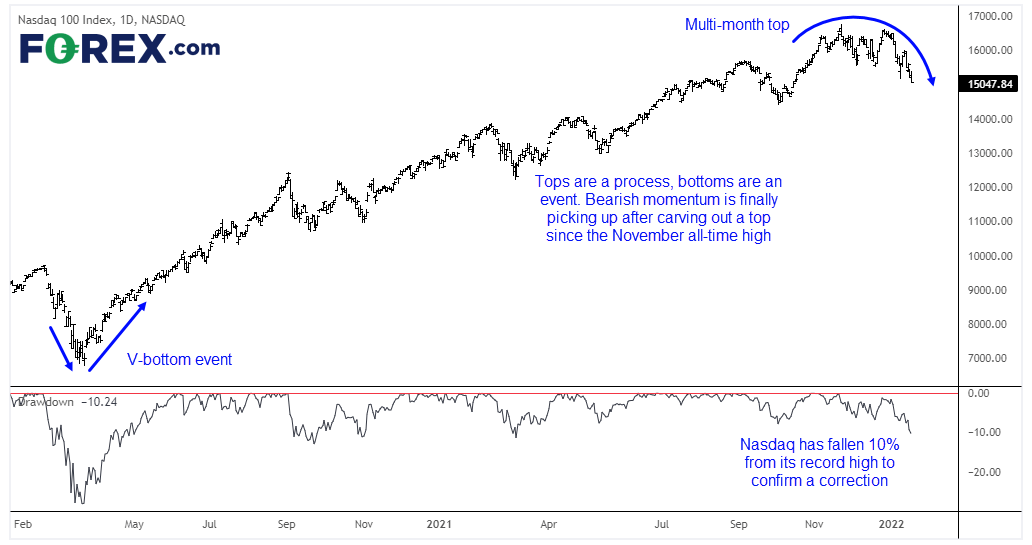
On that note, the Nasdaq 100 has fallen over 10% from its record high which confirms it as a correction over a pullback. Looking across headlines it is a well-publicised event, and that alone leaves the index at risk of a corrective bounce. But we also have the 200-day eMA and 15,000 handle just below yesterday’s close which increases the odds that it might not drop immediately lower, alongside the fact yields in the US stopped rising yesterday (which was a key driver of lower tech stocks) and the Nasdaq’s version of the VIX (NDX) ticked lower yesterday, despite the lower index.


If we look at the daily chart, bearish momentum is now accelerating lower on the Nasdaq 100. However, three clear support zones stand out.
- 15,000 as it is a round number, and right near the 200-day eMA
- 14,800 – 14,900: Unclosed gap, 138.2% Fibonacci projection
- 14,834 – 14,566: October low, 100 / 161.8% Fibonacci projection, long-term 23.8% Fibonacci ratio
We therefore suspect downside could be limited over the near-term and prices could bounce from the 14,800 – 14,900 support zone if prices breach 15,000. But unless we see a decent pullback with bond yields then the core view remains bearish down to the lower support zone, around the October lows. However, a direct move back above 15,500 invalidates our bearish bias.
How to trade with City Index
You can easily trade with City Index by using these four easy steps:
- Open an account, or log in if you’re already a customer
• Open an account in the UK
• Open an account in Australia
• Open an account in Singapore
- Search for the company you want to trade in our award-winning platform
- Choose your position and size, and your stop and limit levels
- Place the trade
How to trade with FOREX.com
Follow these easy steps to start trading with FOREX.com today:
- Open a Forex.com account, or log in if you’re already a customer.
- Search for the pair you want to trade in our award-winning platform.
- Choose your position and size, and your stop and limit levels.
- Place the trade.
Latest market news




The complete CFD trading experience
Award-winning platforms, competitive spreads, low commissions and dedicated support.
We live and breathe the markets and are dedicated to helping traders realise their ambitions as we continue to set the industry bar.
Economic calendar
Web Trader platform
Our sophisticated web-based platform is packed with features.
Related articles
Gold Q4 2026 outlook: Resilience in the face of rallying dollar and yields
As we headed towards the latter stages of Q3 and into Q4, the Fed had just hiked rates in a hawkish FOMC meeting, while the likes of the ECB and BoJ had also tightened their respective policies. Oil prices remained elevated amid the prolonged US-Iran conflict. Meanwhile, bond yields were breaking out, and the dollar was higher across the board. Yet, remarkably, gold was still holding in the positive territory for the third quarter, even if it had weakened somewhat in September.
EUR/USD Q4 2026 Outlook: Euro at a Crossroads as Fed, ECB Tighten 9 25 2026
EUR/USD enters Q4 at a pivotal inflection point as competing Fed-ECB policy paths and persistent inflation risks collide with major technical support.

Equity Indices Q4, 2026 Outlook: Cracks Begin to Show
There's still an open door for a melt-up in the S&P 500 and Nasdaq but the Dow and Russell 2000 are looking more vulnerable, and until calm hits the Treasuries market there's a higher probability for volatility. The big question is whether that's a next quarter theme or not.

StoneX Europe Ltd may make third party material available on this website which may contain information included but not limited to the conditions of financial markets. The material is for information purposes only and does not contain, and should not be construed as containing, investment advice and/or investment recommendation and/or an investment research and/or an offer of or solicitation for any transactions in financial instruments; any decision to enter into a specific transaction shall be made by the client following an assessment by him/her of their situation.
StoneX Europe Ltd makes no representation or warranty and assumes no liability as to the accuracy or completeness of the information provided, nor any loss arising from any investment based on a recommendation, forecast or other information supplied. You should always seek independent advice as to your suitability to speculate in any related markets and your ability to assume the associated risks, if you are at all unsure. We are not under any obligation to update any such material. Any opinion made may be personal to the author and may not reflect the opinion of StoneX Europe Ltd.