


Nasdaq 100 Forecast: Can tech momentum drive new highs?
As the second half of the year begins, short-term strength has become evident again in the Nasdaq 100. The index has gained more than 4.00% over the last two trading sessions, once again highlighting a relevant buying bias.
Share this:

As the second half of the year begins, short-term strength has become evident again in the Nasdaq 100. The index has gained more than 4.00% over the last two trading sessions, once again highlighting a relevant buying bias.
Demand for Nasdaq has recovered as confidence improves in some technology companies. In addition, the calmer tone around the Middle East has also supported a potential recovery in risk appetite. This environment could continue to support relevant buying pressure in the Nasdaq 100 over the next few trading sessions.


Are stocks starting to rebound?
Although the Nasdaq 100 had struggled to gain ground in previous weeks, the demand dynamic appears to have changed after Micron’s results. The company reported revenue above 41 billion dollars, compared with 23 billion in the previous quarter, and mentioned that revenue could approach 50 billion dollars in the next quarter.
This result shows that Micron is not just an isolated case, but also a signal of strong demand tied to the semiconductor industry and artificial intelligence. For this reason, these two sectors could continue to show solid demand, supported by real revenue and strong margins.
This event, along with a possible rebound after several weeks of declines, may be reactivating appetite for equities. The artificial intelligence narrative remains one of the main factors that could support market growth over the coming months.
In fact, this improvement in confidence has been reflected in the performance of the main technology components within the Nasdaq 100. Among the top 15 stocks in the index, several major names are showing strength. Apple is up 2.71% during the session, Nvidia is gaining more than 1.72%, and AMD stands out with an increase of more than 7.6% in the short term. Overall, within the top 15 companies, only three are showing slight declines, which suggests that confidence around the technology sector remains in place as the market waits for new corporate earnings over the next few weeks.
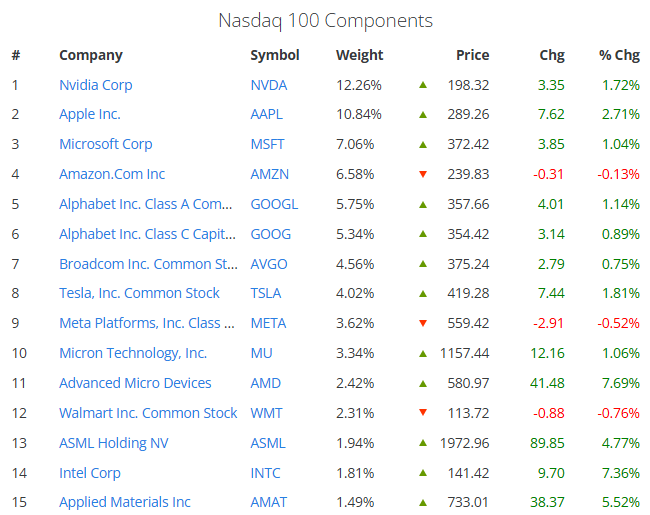
Source: Slickcharts
With this in mind, demand linked to artificial intelligence continues to show a positive short-term outlook. As seen with Micron, this factor could continue to support the broader market if upcoming corporate earnings confirm a similar dynamic.
So far, it is important to keep in mind that Nvidia’s results are expected on August 26. Apple is expected to report on July 30, Microsoft on July 28, Amazon on July 30, and Google around July 28. If these reports show signals similar to Micron’s, the buying pressure currently seen in the index could remain relevant over the medium term.
For now, the sense of calm and the lack of major economic data during the first sessions of the week continue to support relevant optimism, which could remain present over the next few sessions.
Is the Middle East situation helping again?
Over the weekend, there were also relevant updates regarding the conflict in the Middle East. In this case, a temporary ceasefire agreement, or a pause in attacks to continue negotiations, was announced. This came shortly after new military tensions near the Strait of Hormuz over the weekend, while some US officials mentioned that both countries would remain on the sidelines as diplomatic efforts continued.
The important point from these updates is not necessarily a definitive solution, but rather a new short-term de-escalation event. In previous episodes, this type of signal has helped market confidence recover, and it could now be generating another sense of calm.
This is already visible in the Fear and Greed Index. Although the indicator is still moving around the “fear” zone, it managed to advance above 25 points over the last two sessions, showing a slight stabilization in short-term confidence.
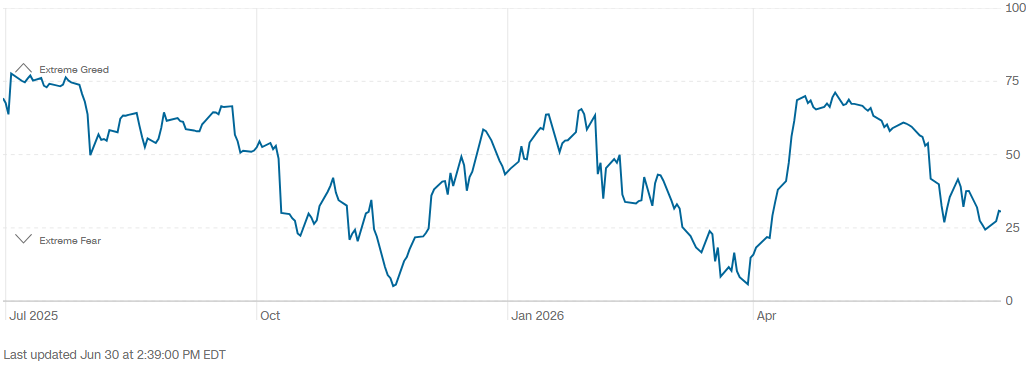
Source: CNN
If calm around the Middle East remains in place, a gradual recovery in confidence could continue to support appetite for risk assets. This could be favorable for the Nasdaq 100 in the short term and may keep relevant buying pressure in place over the next few trading sessions.
Technical outlook for the Nasdaq 100
Source: StoneX, Tradingview
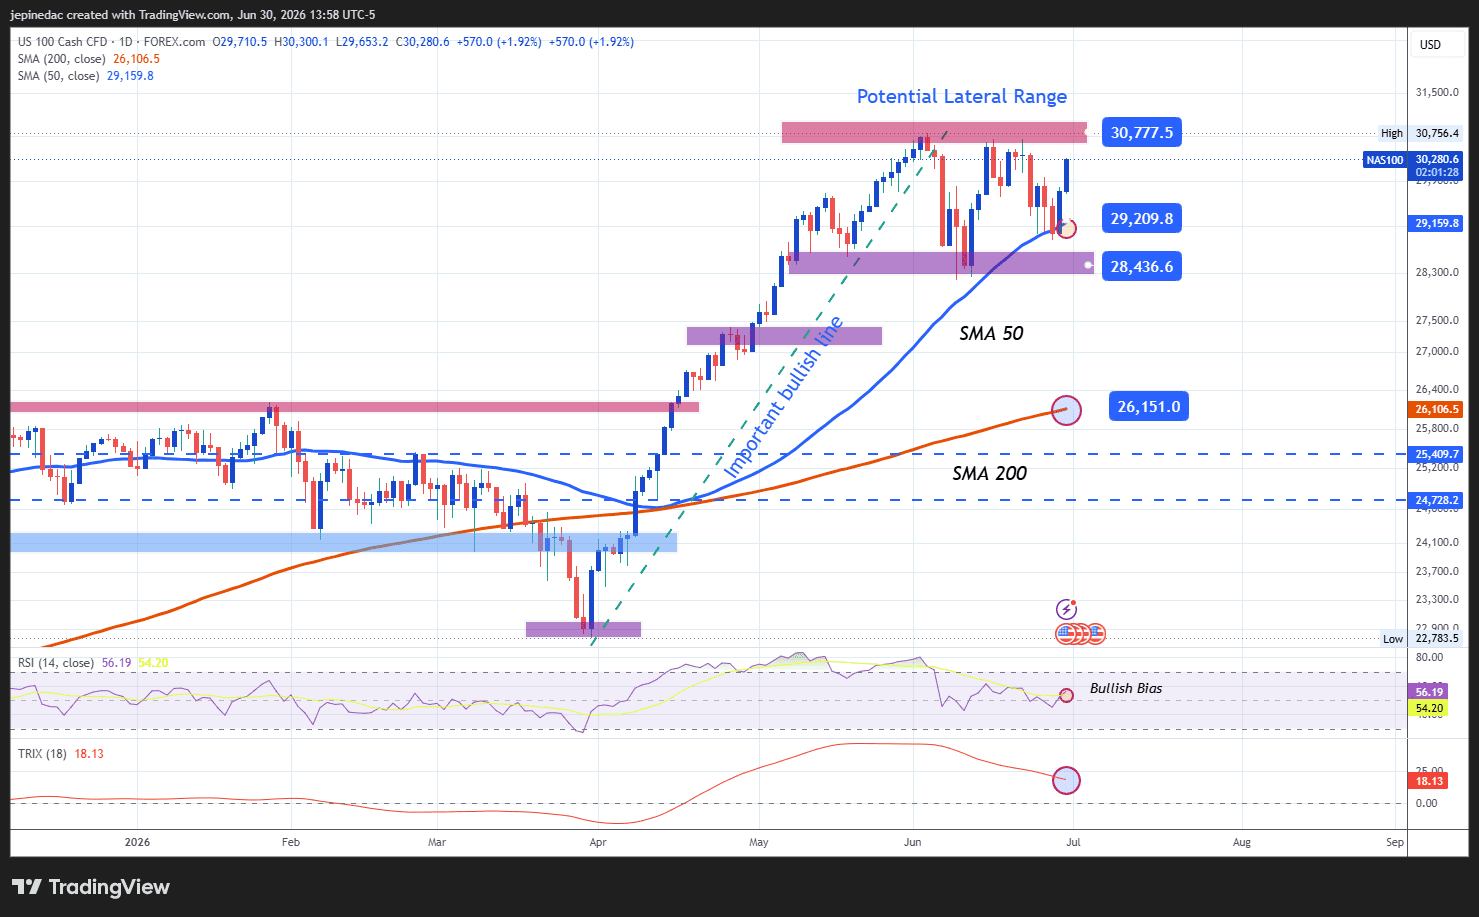
- The sideways range tries to hold: Over the last few weeks of trading, the Nasdaq 100 has started to form a relevant sideways range in the short term. So far, price remains between the upper area near 30,700 points and support close to 28,400 points. Although recent bullish pressure has started to become important, it still does not seem strong enough to break this channel. For now, this remains the most important technical structure to watch, as it could make it harder for a clearer bullish trendline to form.
- RSI: The RSI remains above the 50 neutral level, suggesting that the average bullish impulse over the last 14 sessions has started to gain relevance. If this dynamic continues, buying pressure could remain part of the short-term price action on the chart.
- TRIX: However, the TRIX indicator shows a more cautious reading. Although the indicator line remains above the 0 neutral level, it still holds a clear downward slope. This suggests that the average medium-term strength continues to show signs of weakness and that indecision has not fully disappeared from the chart.
Key levels:
- 30,770 points – Relevant resistance: All-time high area that, for now, works as the most important reference for bullish movements. Moves toward this level could reinforce the importance of a renewed buying bias and revive the bullish trend that had been relevant in previous sessions.
- 29,200 points – Nearby barrier: Relevant neutrality zone that coincides with important short-term pullbacks and aligns with the 50-period simple moving average. As long as price remains close to this level, the phase of indecision could continue to gain relevance and open the door to an extension of the sideways range over the next few sessions.
- 28,420 points – Key support: Relevant low area from recent weeks and the main downside barrier for now. Sustained moves below this point could start to show a dominant selling bias and open the door to more consistent selling pressure over the coming weeks.
Written by Julian Pineda, CFA, CMT – Market Analyst
Follow him on: @julianpineda25
Latest market news




The complete CFD trading experience
Award-winning platforms, competitive spreads, low commissions and dedicated support.
We live and breathe the markets and are dedicated to helping traders realise their ambitions as we continue to set the industry bar.
Economic calendar
Web Trader platform
Our sophisticated web-based platform is packed with features.
Related articles

Nasdaq 100 Forecast: NDX Falls as the tech rout continues and oil prices soar
U.S. stocks are pointing to a modestly lower open after a sharp AI sell-off yesterday, as telecom stocks slide. Brent rises towards $115 adding to inflation pressures ahead of the FOMC rate decision.


S&P 500 forecast: AI linked stocks remain under pressure
And just like that, it is Friday again and the end of a volatile week. Today offers little on the macro calendar to change the prevailing narrative, leaving markets largely at the mercy of risk appetite, oil prices and the growing unease around the AI trade.


Nasdaq 100 Slides as Meta Posts Strong Results and Drops 6%
The Nasdaq 100 sell-off is being driven by doubts over AI spending, as investors punish strong earnings that fail to justify stretched valuations.
StoneX Europe Ltd may make third party material available on this website which may contain information included but not limited to the conditions of financial markets. The material is for information purposes only and does not contain, and should not be construed as containing, investment advice and/or investment recommendation and/or an investment research and/or an offer of or solicitation for any transactions in financial instruments; any decision to enter into a specific transaction shall be made by the client following an assessment by him/her of their situation.
StoneX Europe Ltd makes no representation or warranty and assumes no liability as to the accuracy or completeness of the information provided, nor any loss arising from any investment based on a recommendation, forecast or other information supplied. You should always seek independent advice as to your suitability to speculate in any related markets and your ability to assume the associated risks, if you are at all unsure. We are not under any obligation to update any such material. Any opinion made may be personal to the author and may not reflect the opinion of StoneX Europe Ltd.