



Nasdaq, Dow Jones analysis: Get your headset around Apple’s key reversal
Price action suggests the relative performance between the Nasdaq 100 and Dow Jones could be at or near an inflection point. And Apple's stock price hints at a pullback following yesterday's key reversal day.
Share this:

The Nasdaq 100 has been the outperformer of Wall Street rising just over 40% from its 2022 low, compared with the S&P 500 which rose just 23.1% and the Dow Jones 17% rally over the same period. However, as anyone who reads the fine print knows, past performance is not indicative of futures results (and markets do not move in straight line). And that means there will be occasions where the relative performance between markets trending in the same direction shift over time. And we may be approaching such a shift between the Nasdaq 100 and Dow Jones, looking at their respective price action.
Dow Jones Industrial weekly chart:
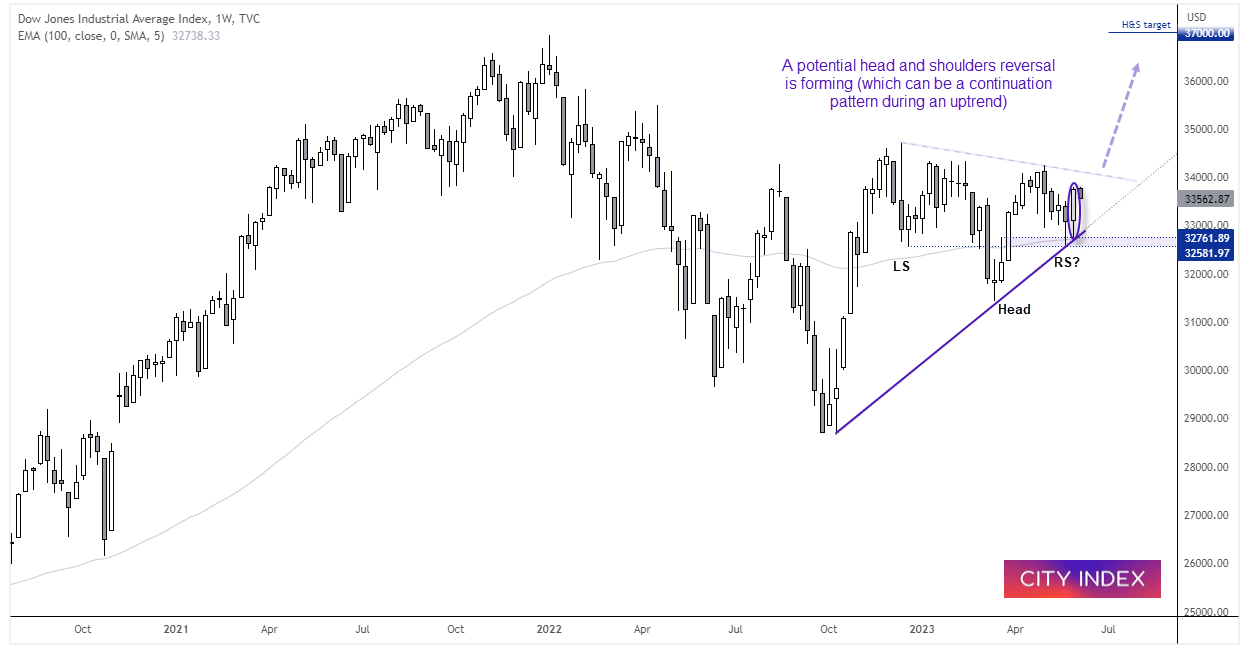

The Dow Jones has very much been the laggard of the Wall Street indices, but its bullish engulfing candle formed last week warrants attention. Not only was it the most bullish week in nine, but its low respected the October low trend support, 100-week EMA and was above the prior week’s low. Furthermore, this could be part of a right shoulder (RS) of a head and shoulders reversal which can be a continuation pattern during an uptrend. A break of the neckline is required to confirm the bullish reversal pattern, which projects a target around 37,000.
We’ll not hang our hats on that upside target, but over the near term there is clearly demand around the 35-37k area, and it shows the potential to move to the 35k area whilst prices remain above 32,580.
Nasdaq 100 daily chart
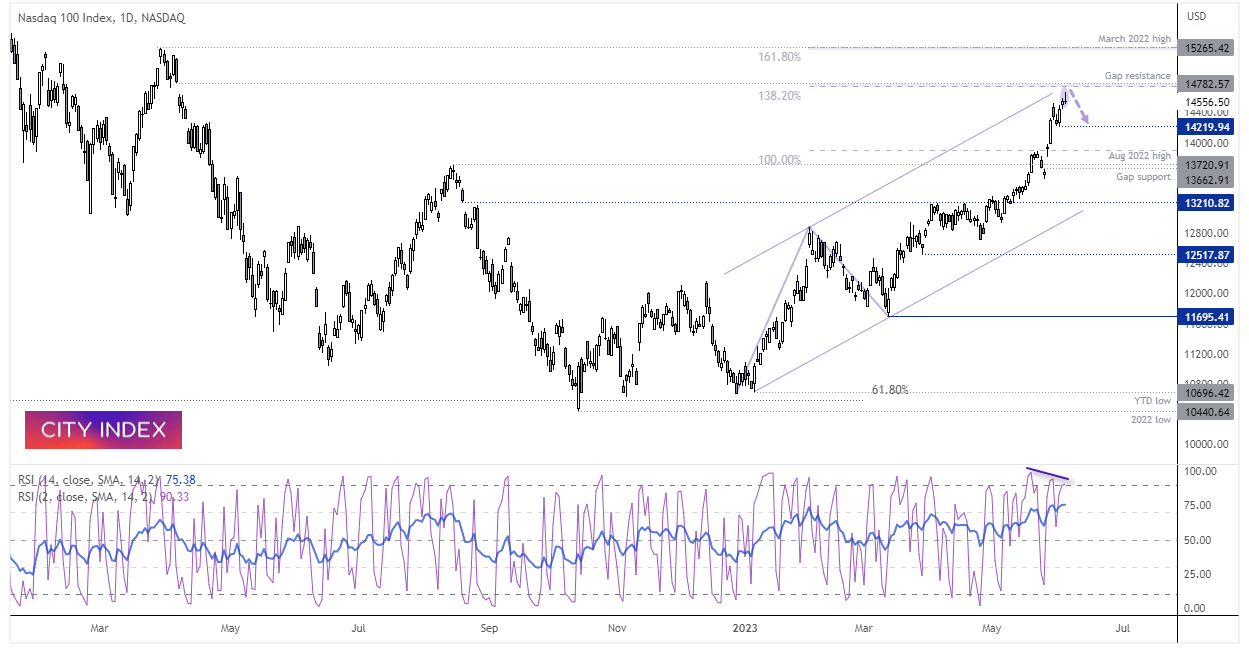

Whilst the Nasdaq has enjoyed the stronger rally of Wall Street, perhaps it is close to becoming a victim of its own success as investors question its upside potential after such a hot run. Furthermore, there are signs on the weekly chart that the rally is losing steam, following a hanging man candle last week. A bearish divergence is also forming on the daily chart with RSI (2) and RSI (14) is overbought.
Volatility over the past two days has been low with a bearish Pinbar forming yesterday. The rally is also close to a resistance zone around 4,780 which includes gap resistance and a 138.2% Fibonacci ratio. Even it is climbs above these levels, the March 2022 high then comes into focus.
Whether bears want to fade at these levels is up for debate, but bulls may want to tread carefully given the signs of weaker momentum around cycle highs following a strong run.
Get your headset around Apple’s key reversal day:
Apple has risen 38.2% year to date, or 48.9% from the January low to yesterday’s high. Yet despite these strong gains, it ranks only 22 in the top 100 performs in the Nasdaq this year with the top eight rising over 50% (led by Nvidia at 168% and Meta at 125.5%). Clearly, AI has been a key driver for a few select few stocks which has helped support broader indices whilst leaving the smaller companies for dust. But Apple intends to close that gap.
After years of speculation, Apple finally announced a product to enter the virtual reality space with the augmented reality headset – the Vision Pro. Coming in at an eye-watering US $3,499 it is around three times the cost of Meta’s version, but this is something we generally expected from Apple. They also announced several AI features to run on their iOS devices as opposed to relying on the cloud like their rivals. And that is quite a ‘smart’ move, given AI can easily be implemented for use on the millions of iPhones and tablets used each day, whilst also bypassing privacy issues faced by cloud-based AI.
Apple (AAPL) daily chart:

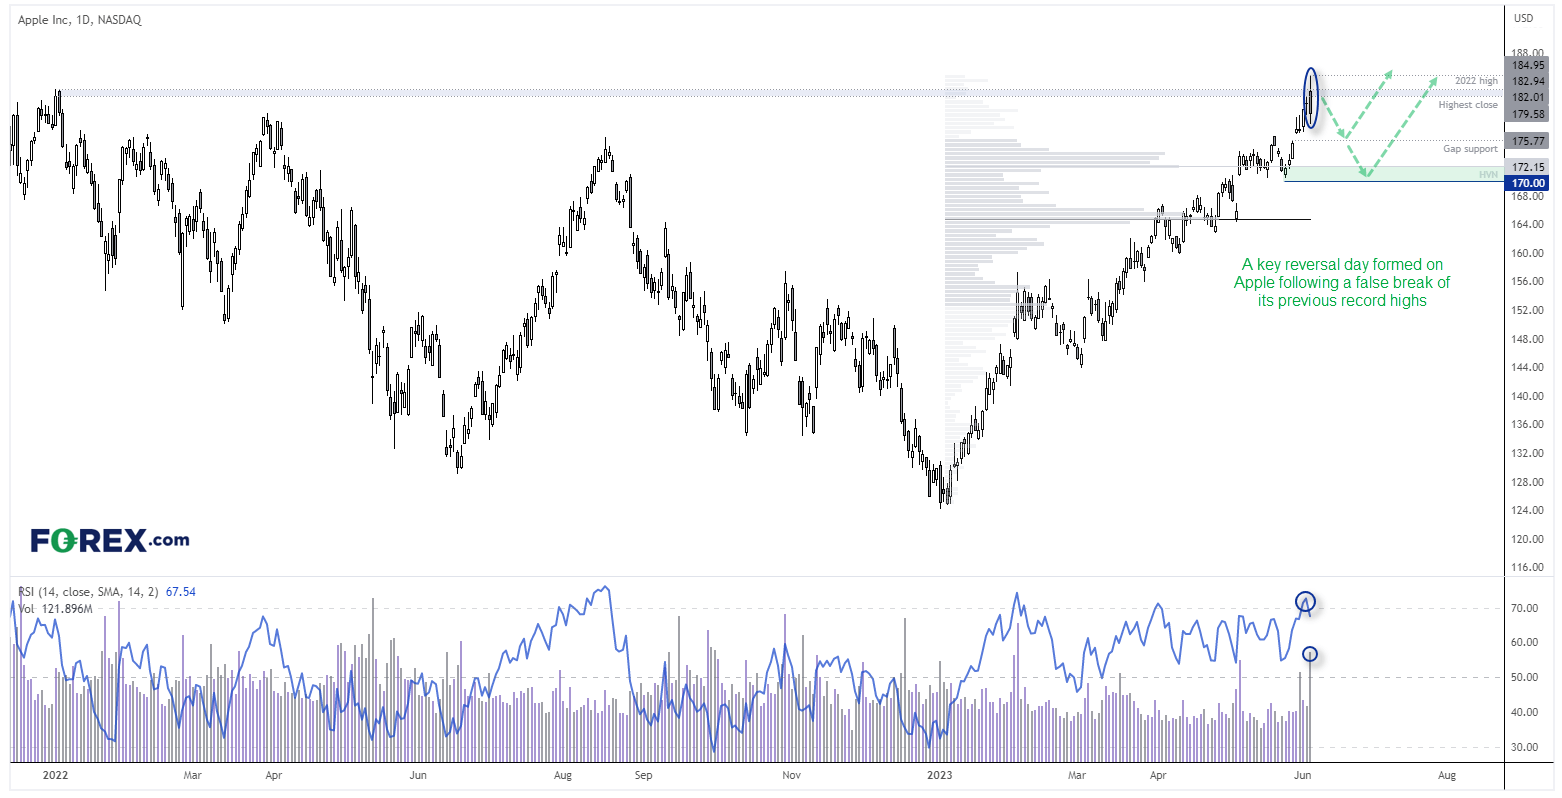
Yet investors seemed a little underwhelmed by the close, as the intraday record high was short lived and the day closed with a bearish engulfing / outside day. The fact is closed back beneath the previous record highs is also worth noting, and it can be deemed a ‘key reversal’ day due to the high volume set that day.
Whilst RSI (14) reached oversold on Friday, there’s no bearish divergence as of yet to indicate a reversal, so perhaps we’re looking at a pullback within the current trend as opposed to a three-wave correction lower.
For now, bears could seek to fade into minor rallies with yesterday’s range and seek an initial move to gap support around 175.77, with 172.50 to and 170 also providing potential support levels. Alternatively, bulls cold wait for a retracement towards support and seek evidence of a swing low with a view to rejoin the bullish trend on the daily chart.
-- Written by Matt Simpson
Follow Matt on Twitter @cLeverEdge
How to trade with City Index
You can trade with City Index by following these four easy steps:
- Open an account, or log in if you’re already a customer
• Open an account in the UK
• Open an account in Australia
• Open an account in Singapore
- Search for the market you want to trade in our award-winning platform
- Choose your position and size, and your stop and limit levels
- Place the trade
Related tags:
Latest market news




The complete CFD trading experience
Award-winning platforms, competitive spreads, low commissions and dedicated support.
We live and breathe the markets and are dedicated to helping traders realise their ambitions as we continue to set the industry bar.
Economic calendar
Web Trader platform
Our sophisticated web-based platform is packed with features.
Related articles
Equity Indices Q4, 2026 Outlook: Cracks Begin to Show
There's still an open door for a melt-up in the S&P 500 and Nasdaq but the Dow and Russell 2000 are looking more vulnerable, and until calm hits the Treasuries market there's a higher probability for volatility. The big question is whether that's a next quarter theme or not.


Oil Quietly Hands the Fed a Reason to Stay Hawkish
Oil prices and the U.S. dollar are both on the front foot as elevated energy costs feed Fed warnings that inflation may prove sticky.


S&P 500 forecast: Stocks extend drop as correction risks grow
US and global equity markets have extended Wednesday’s sell-off, with Wall Street opening lower after a weak handover from Asia and Europe. The deterioration in risk appetite has been spreading across global markets. The dollar was firmer, Treasury yields were holding onto yesterday’s gains, while gold, silver and bitcoin were all under pressure alongside equities and major currencies.
StoneX Europe Ltd may make third party material available on this website which may contain information included but not limited to the conditions of financial markets. The material is for information purposes only and does not contain, and should not be construed as containing, investment advice and/or investment recommendation and/or an investment research and/or an offer of or solicitation for any transactions in financial instruments; any decision to enter into a specific transaction shall be made by the client following an assessment by him/her of their situation.
StoneX Europe Ltd makes no representation or warranty and assumes no liability as to the accuracy or completeness of the information provided, nor any loss arising from any investment based on a recommendation, forecast or other information supplied. You should always seek independent advice as to your suitability to speculate in any related markets and your ability to assume the associated risks, if you are at all unsure. We are not under any obligation to update any such material. Any opinion made may be personal to the author and may not reflect the opinion of StoneX Europe Ltd.