



Oil, USD/JPY Forecast: Two trades to watch
Oil rises towards a 6-week high as tensions in the Middle East escalate. USD/JPY on intervention watch above 163.
Share this:

Oil rises towards a 6-week high as Middle East tensions escalate
Oil prices are extending gains towards a six-week high amid fears of further supply disruption after the U.S. and Iran exchanged fire for an 11th consecutive night. Meanwhile, oil tankers made U-turns in the Red Sea following warnings of disruption from Iran-backed Houthi forces.
The continued exchange of strikes between the U.S. and Iran has heightened concerns over further disruption to energy supplies. Despite talk of mediation earlier in the week, hostilities appear to be escalating rather than easing.
Adding to those concerns, the Iran-backed Houthis have opened a new front by threatening to target vessels carrying Saudi crude through the Bab el-Mandeb Strait. They have also announced a naval blockade of Saudi Arabia.
The Bab el-Mandeb has become an increasingly important route for Saudi crude exports as traffic through the Strait of Hormuz has declined sharply since the U.S.-Iran ceasefire collapsed. Three Saudi oil tankers reportedly made U-turns in the Red Sea yesterday.
Should the Bab el-Mandeb Strait also become inaccessible, tankers would be forced to reroute via the Suez Canal, adding both time and cost to shipments to Asia.
Oil forecast – technical analysis
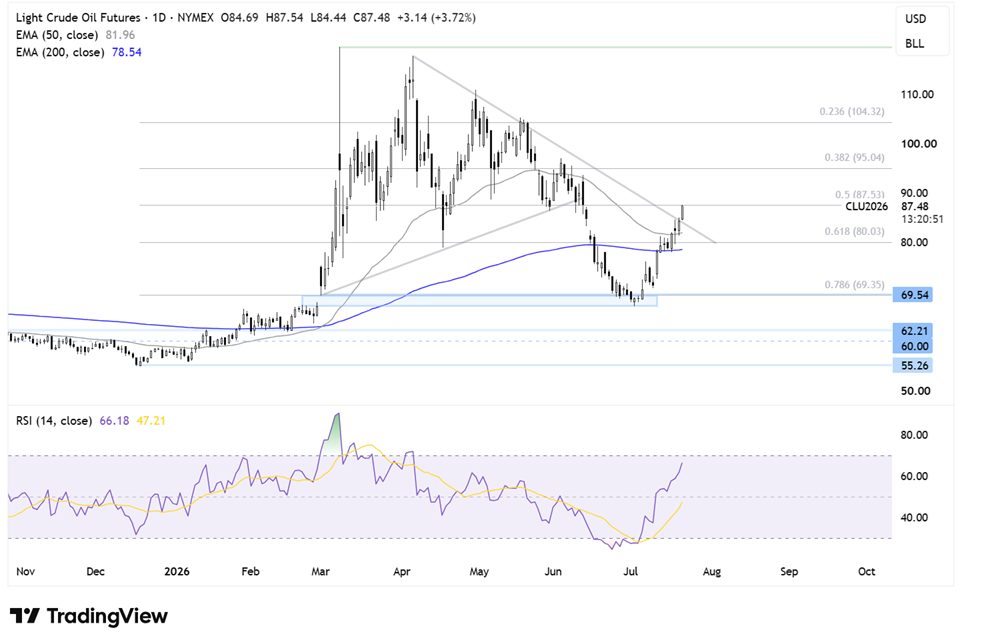
Oil broke above the symmetrical triangle pattern before running into resistance around $87. The price continues to trade above the 50-day and 200-day EMAs, as well as the rising trendline support. Combined with the RSI holding above 50, this keeps the near-term outlook constructive.
Buyers will look to break above $88, the 50% Fibonacci retracement of the $55–$120 move. A rise above here brings $95, the 38.2% Fibonacci retracement, into focus, ahead of the $100 psychological level.
Initial support can be seen at $84.50, ahead of the rising trendline, the 50-day EMA at $81.85, and $80, the 61.8% Fibonacci retracement.
Below there, support is seen around $78, where the 200-day EMA sits. A break below this level could see sellers gain traction towards $70.67, the July low.
USD/JPY on intervention watch above 163
USD/JPY has climbed to a fresh 40-year high above 163 as rising oil prices and higher U.S. Treasury yields continue to support the dollar, leaving investors increasingly nervous about the risk of Japanese intervention.
The dollar is finding support from safe-haven demand as the conflict in the Middle East continues.
At the same time, rising oil prices are adding to inflation concerns, helping push the benchmark 10-year Treasury yield to its highest level since May earlier this week.
However, the Japanese yen is failing to benefit from safe-haven demand given Japan's reliance on imported energy, making it particularly vulnerable when oil prices rise.
With the yen at its weakest level since 1986, markets remain on intervention watch after Japanese authorities stepped in during both April and May once USD/JPY moved above 160.
Previous intervention only slowed the move temporarily, with the underlying uptrend quickly reasserting itself.
With USD/JPY now trading above 163, the risk of another intervention is rising. However, while intervention can slow momentum, it rarely changes the broader trend unless it is backed by a more hawkish Bank of Japan and a less hawkish Federal Reserve.
For now, the wide interest rate differential continues to favour the dollar, making yen rallies attractive selling opportunities.
While the U.S. economic calendar is relatively quiet this week, attention will be on Friday's PMI data. In Japan, focus will turn to inflation figures released early Friday morning.
USD/JPY forecast – technical analysis
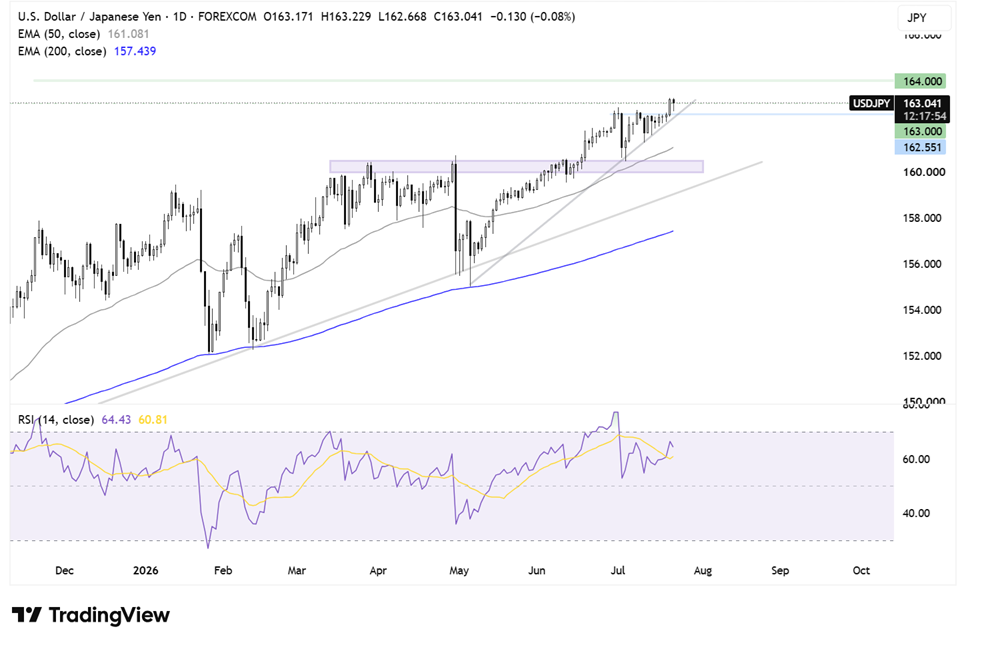
USD/JPY continues to extend its bullish run, trading above its rising trendline and both the 50-day and 200-day EMAs after climbing to 163.25.
However, momentum is beginning to slow, and the bearish RSI divergence suggests buyers should be a little more cautious.
Even so, buyers will look to extend gains towards 164.00, the next key psychological level.
On the downside, initial support can be be seen around 162.50. A break below here brings the 50-day SMA around 161.00 into focus before attention turns to the 160.00 support zone.
Related tags:



The complete CFD trading experience
Award-winning platforms, competitive spreads, low commissions and dedicated support.
We live and breathe the markets and are dedicated to helping traders realise their ambitions as we continue to set the industry bar.
Economic calendar
Web Trader platform
Our sophisticated web-based platform is packed with features.
Related articles

Japanese Yen Technical Analysis: USD/JPY Support Test into Core PCE
USD/JPY has been a battlefield for the past two months as the force of intervention and the threat of more have given sellers an advantage, even as buyers have continued to bid support on pullbacks. This sets the stage for a massive finish to the week with Core PCE and Non-farm Payrolls.


EUR/USD, USD/JPY Outlook: Oil, yields and an FX identity crisis
Crude oil is setting the tone across rates and FX, leaving EUR/USD vulnerable and USD/JPY caught between higher Treasury yields and the growing threat of intervention

USD into a Massive Week as Yields Fly and Gold Breaks
It’s a huge week with PCE and NFP, but it’s what’s happening off of the calendar that demands attention with US yields flying to fresh multi-decade highs.
StoneX Europe Ltd may make third party material available on this website which may contain information included but not limited to the conditions of financial markets. The material is for information purposes only and does not contain, and should not be construed as containing, investment advice and/or investment recommendation and/or an investment research and/or an offer of or solicitation for any transactions in financial instruments; any decision to enter into a specific transaction shall be made by the client following an assessment by him/her of their situation.
StoneX Europe Ltd makes no representation or warranty and assumes no liability as to the accuracy or completeness of the information provided, nor any loss arising from any investment based on a recommendation, forecast or other information supplied. You should always seek independent advice as to your suitability to speculate in any related markets and your ability to assume the associated risks, if you are at all unsure. We are not under any obligation to update any such material. Any opinion made may be personal to the author and may not reflect the opinion of StoneX Europe Ltd.