



S&P 500 forecast tilted lower as traders watch crude oil for direction
US index futures tumbled overnight as oil prices spiked, before recovering some ground as crude eased. Markets remain extremely volatile, with traders focusing almost entirely on developments in the Middle East and movements in oil prices. For now, little else seems to matter.
Share this:

US index futures tumbled overnight as oil prices spiked, before recovering some ground as crude eased. Markets remain extremely volatile, with traders focusing almost entirely on developments in the Middle East and movements in oil prices. For now, little else seems to matter. The release of emergency oil stockpiles has done little to calm the oil market, which means the S&P 500 forecast remains tilted to the downside. Fresh disruptions in Oman and Iraq pushed Brent crude back toward $100 per barrel overnight, before prices eased to around $95. If oil resumes its climb, equity markets could face renewed pressure, particularly in Europe where stocks have already shown greater vulnerability.
Middle East war escalates and disrupts energy markets
The conflict in the Middle East continues to intensify, with Iran escalating attacks across the Persian Gulf region while tightening its grip around the Strait of Hormuz, a critical global oil shipping route. Reports suggest strikes have hit several locations across the Gulf:
- Attacks reported in Dubai
- Kuwait International Airport sustaining damage from drones
- Two crude tankers hit in Iraqi waters
- Oman evacuating the Mina Al Fahal oil export terminal, halting operations temporarily
Meanwhile, Israel says it has begun large-scale strikes across Iran, raising fears that the conflict could expand further and disrupt energy supplies for longer.
Oil volatility keeps markets on edge
Oil remains the primary driver of market sentiment. Brent briefly surged above $100 per barrel, sending equities lower across global markets before easing back to around $95. The IEA’s release of 400 million barrels from strategic reserves failed to stabilise prices, especially after fresh supply threats emerged.
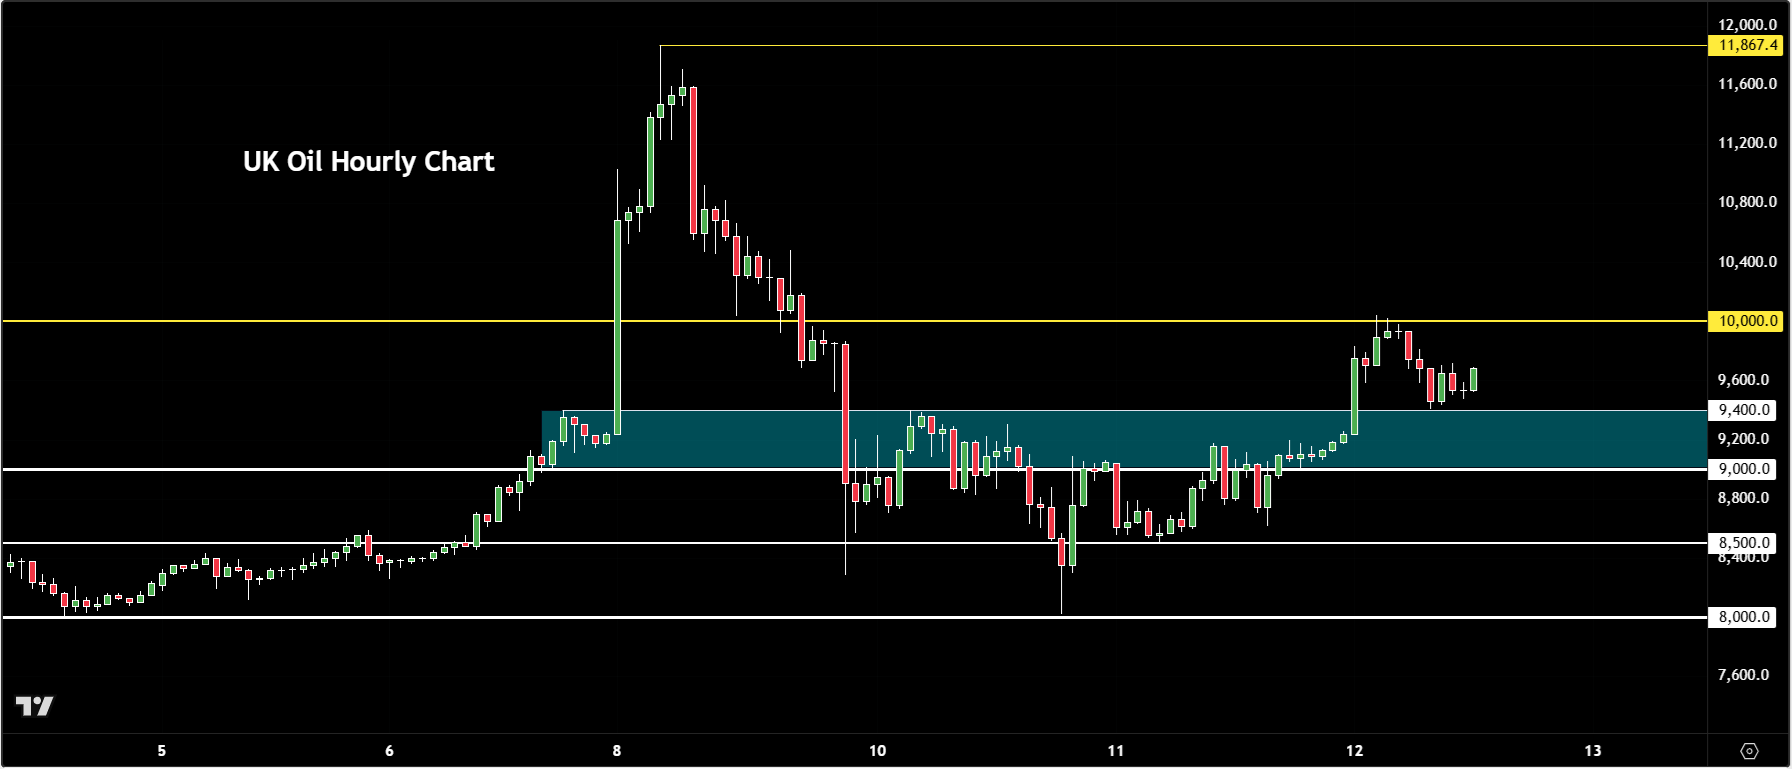
The key question for investors now is how long the disruptions will last. Markets are also becoming increasingly desensitised to political headlines, including claims from President Trump that the US is close to achieving its military objectives.
For now, equities remain stuck in a headline-to-headline trading environment, with signals from the oil market suggesting downside risks remain elevated.
Technical S&P 500 forecast and levels to watch
Looking at the S&P 500 chart, we can see that the index has been making lower lows and lower highs ever since it created an all-time high earlier this year. This means that, for now, we are favouring support levels to break rather than resistance level, particularly so long as the index remains inside this intraday bearish channel:
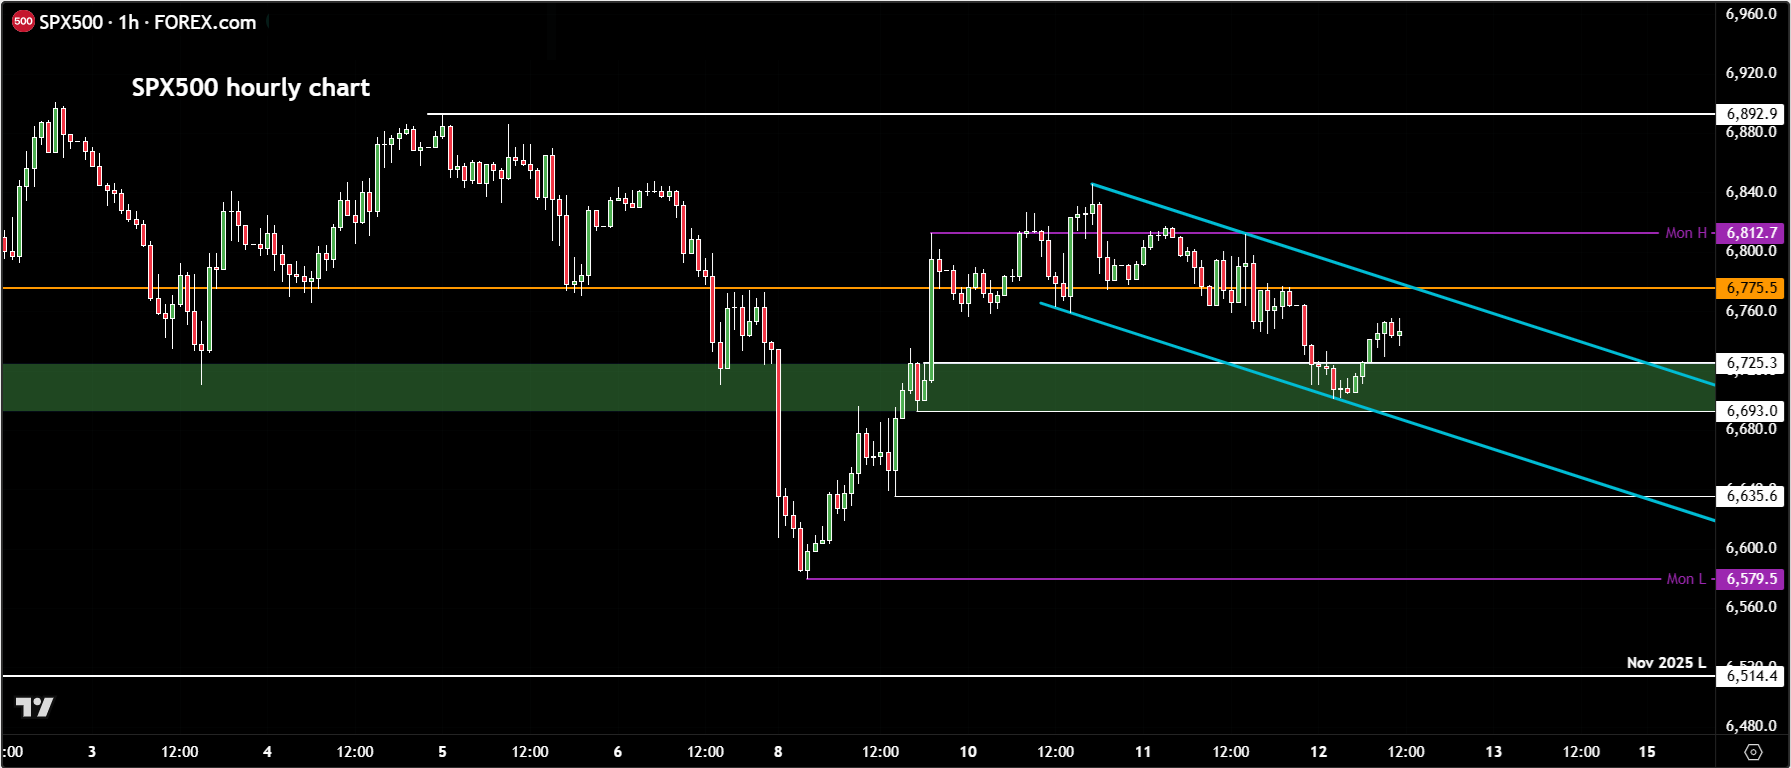
In other words, we could see further support levels breaking down as the conflict continues, while resistance levels may continue to hold, providing tradeable opportunities for the shorts or the bears.
That said, the downside has been relatively limited for US markets, certainly when compared with some of the other global indices, particularly in Europe. Technology-heavy US indices have shown more resilience in comparison.
The key resistance zone to watch comes in between 6775 and 6800. This zone previously acted as strong support on multiple occasions before we saw a clean breakdown below it on Friday last week.
Then on Monday, the index gapped lower before rebounding sharply, eventually closing the day in positive territory. However, since then we haven’t seen any meaningful upside follow-through, which has largely been the story across global markets ever since the war started.
To me, this suggests that bullish traders may be getting trapped. If that’s the case, I would expect the S&P 500 to eventually return to Monday’s low, where there will likely be a cluster of stop orders from traders who bought that dip.
Monday’s low comes in at 6579, and I wouldn’t be surprised to see the index drift back towards that level.
Before that, however, there is an interim support zone between 6693 and 6725, which I’ve marked in green on the chart. This area needs to break decisively for the market to start feeling renewed selling pressure.
If the selling pressure continues, then we also have to ask: why stop there?
The next downside level to watch would be the November low at 6514, which becomes the next bearish target.
For the technical S&P 500 forecast to shift more towards the bullish scale, we would need to see a proper higher high above the recent local highs, which would start tipping the balance back in favour of the bulls.
In particular, the 6893 level — which marks the most recent local — would need to break convincingly for me to turn bullish from a technical perspective.
But right now, it’s all about Iran and oil prices, and you can forget about almost everything else.
Hedge funds face biggest drawdown since tariff turmoil
Adding to the cautious tone, hedge funds are experiencing their largest drawdown since the “Liberation Day” tariff turmoil. That is according to strategists at JPMorgan, who have highlighted the unwind of crowded trades hitting fast-money investors particularly hard. If the war drags on and oil prices remain elevated, we could see further withdrawals from equity funds, adding another layer of downside pressure to global stock markets.

-- Written by Fawad Razaqzada, Market Analyst
Follow Fawad on Twitter @Trader_F_R
Latest market news




The complete CFD trading experience
Award-winning platforms, competitive spreads, low commissions and dedicated support.
We live and breathe the markets and are dedicated to helping traders realise their ambitions as we continue to set the industry bar.
Economic calendar
Web Trader platform
Our sophisticated web-based platform is packed with features.
Related articles
Gold outlook: XAU/USD hammered, stretched and vulnerable to a sharp rebound
Gold is getting hammered for solid fundamental reasons, but history suggests extreme four-hourly oversold conditions can produce violent countertrend rallies.
Gold forecast: Rising yields become too hot for gold, but the outlook is far from bearish
Gold and silver prices took a plunge today, with the former down 3% and the latter falling some 5% by mid European session, before bouncing off their lows. The losses come after the metals remained largely supported until last week, despite the big dollar rally and surging bond yields as we have seen in recent weeks. But it simply got too much, and the metals succumbed to pressure today.

AUD/USD forecast: Currency Pair of the Week | September 28, 2026
The week has started with stocks, gold, silver and bitcoin all falling, as crude oil rebounded and bond yields pushed further higher. Trump refusing to agree to Tehran’s proposal to re-open the Strait of Hormuz has left the markets disappointed. Still, reports that mediators are expected to hold talks with the two sides on an amended version of the 7-day proposal that Iran presented, keeps hopes alive that we may see some progress.
StoneX Europe Ltd may make third party material available on this website which may contain information included but not limited to the conditions of financial markets. The material is for information purposes only and does not contain, and should not be construed as containing, investment advice and/or investment recommendation and/or an investment research and/or an offer of or solicitation for any transactions in financial instruments; any decision to enter into a specific transaction shall be made by the client following an assessment by him/her of their situation.
StoneX Europe Ltd makes no representation or warranty and assumes no liability as to the accuracy or completeness of the information provided, nor any loss arising from any investment based on a recommendation, forecast or other information supplied. You should always seek independent advice as to your suitability to speculate in any related markets and your ability to assume the associated risks, if you are at all unsure. We are not under any obligation to update any such material. Any opinion made may be personal to the author and may not reflect the opinion of StoneX Europe Ltd.