


S&P 500 outlook: De-escalation rally could run out of fuel
While optimism about de-escalation has lifted stocks and pressured oil prices since the early hours of Tuesday’s session, it is important not to get too ahead of ourselves just yet. For one thing, Iran has just announced that the Strait of Hormuz won’t reopen due to Trump’s “absurd” displays.
Share this:

While optimism about de-escalation has lifted stocks and pressured oil prices since the early hours of Tuesday’s session, it is important not to get too ahead of ourselves just yet. For one thing, Iran has just announced that the Strait of Hormuz won’t reopen due to Trump’s “absurd” displays. Iran’s Foreign Minister Araghchi stated that only Iran and Oman will determine the future of the Strait. Separately, there are reports suggesting Trump will announce a ground offensive tonight. That will only escalate the matters, if confirmed. Iran has separately announced planned strikes on American businesses in the Gulf region. All it takes is another spike in oil prices to unwind the gains we have seen in stock markets. Against this backdrop, we maintain a cautious S&P 500 outlook.
Why have stocks bounced back?
The S&P 500 has been in recovery mode for the past two days, following a strong upside move yesterday. This was largely driven by comments from Donald Trump suggesting the war with Iran could potentially be coming to an end within the next couple of weeks. That optimism has been reflected in rising equity prices, while crude oil has eased lower. However, I don’t think the pressure is likely to fully subside until the Strait of Hormuz is reopened — and that’s where the real uncertainty lies.
How to trade these markets
The key question for investors now is: do you continue trading in a risk-off environment, keeping equity exposure light? Or do you start to believe the worst is behind us and begin buying the dips?
For what it’s worth, I’m not yet convinced that the conflict will end as quickly as some are hoping. I hope I’m wrong, but it seems likely that Iran will ensure any ceasefire agreement works firmly in its favour and protects its long-term interests. They will want guarantees that hostilities won’t flare up again.
So, I don’t think the situation is as straightforward as it’s being portrayed. Yes, if tensions do ease, markets could stabilise over time — but whether Iran allows the Strait of Hormuz to fully reopen and traffic to flow freely remains a major question.
S&P 500 outlook: Technical analysis and levels to watch
From a technical standpoint, it’s still far too early to suggest that markets have bottomed out, meaning our S&P 500 outlook remains cautious for now.
Yes, the index has rebounded strongly, but we are still trading below the 200-day moving average and yet to fully reclaim the resistance area of 6600. That suggests the path of least resistance is not yet clearly higher.
For now, this remains a levels-driven market, where trading from one key level to the next is the most effective approach.
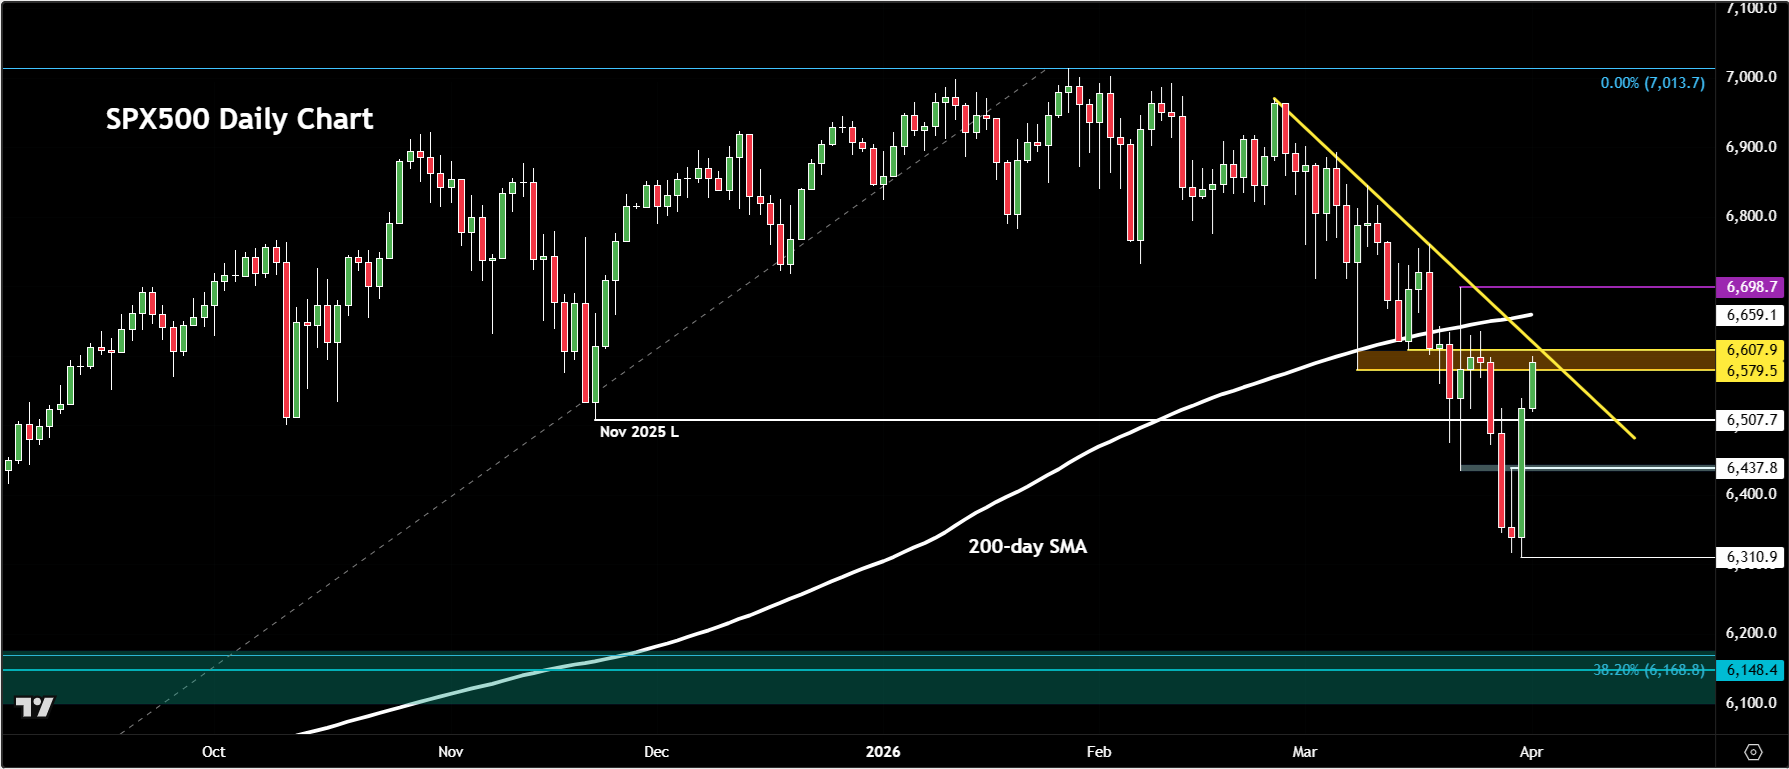
At the moment, our SPX500 index, which is derived from the underlying S&P 500 futures, is facing resistance around 6,600, which was a prior support level where last week’s sell-off began. Just above that, the 200-day moving average sits near 6,660, adding another layer of resistance.
To shift the bias back to bullish, we would need to see a higher high above 6,699.
On the downside, yesterday’s high at 6,539 now acts as the first level of support on any pullback, followed by the 6507 level, marking the November 2025 low.
Below that, the key support zone sits between 6,435 and 6,455. This area previously acted as both support and resistance before yesterday’s breakout, and it now needs to hold if the market is to build anything more than just a short-covering rally.
That 6,435–6,455 zone will be critical in determining whether the S&P 500 can sustain a more meaningful recovery.


-- Written by Fawad Razaqzada, Market Analyst
Follow Fawad on Twitter @Trader_F_R
How to trade with City Index
You can trade with City Index by following these four easy steps:
- Open an account, or log in if you’re already a customer
• Open an account in the UK
• Open an account in Australia
• Open an account in Singapore
- Search for the company you want to trade in our award-winning platform
- Choose your position and size, and your stop and limit levels
- Place the trade


The complete CFD trading experience
Award-winning platforms, competitive spreads, low commissions and dedicated support.
We live and breathe the markets and are dedicated to helping traders realise their ambitions as we continue to set the industry bar.
Economic calendar
Web Trader platform
Our sophisticated web-based platform is packed with features.
Related articles
USD/JPY forecast: US dollar strengths amid hawkish Fed despite recent oil weakness
The US dollar has extended its gains this morning, even if oil prices finished lower for the fifth consecutive day yesterday. Oil prices have bounced back in this first half of today’s session, causing a bit of pressure on currencies that rely on energy imports such as the euro, pound, Swiss franc, and Japanese yen. But it was the dollar that was exerting the most pressure, amid hawkish FedSpeak. Meanwhile, European indices and precious metals were also under a bit of pressure amid the strength of the dollar.

Why Crude Oil Slid While Middle East Tensions Kept Building
The crude oil pullback from monthly highs is running ahead of the headlines, as WTI and Brent ease while Middle East tensions stay unresolved.


EUR/AUD, GBP/AUD Outlook: Rates, risk and metals reinforce bearish technical case
EUR/AUD and GBP/AUD are coiling near support, with recent correlations suggesting the Aussie’s strength is being driven more by rates, risk and metals than energy.

StoneX Europe Ltd may make third party material available on this website which may contain information included but not limited to the conditions of financial markets. The material is for information purposes only and does not contain, and should not be construed as containing, investment advice and/or investment recommendation and/or an investment research and/or an offer of or solicitation for any transactions in financial instruments; any decision to enter into a specific transaction shall be made by the client following an assessment by him/her of their situation.
StoneX Europe Ltd makes no representation or warranty and assumes no liability as to the accuracy or completeness of the information provided, nor any loss arising from any investment based on a recommendation, forecast or other information supplied. You should always seek independent advice as to your suitability to speculate in any related markets and your ability to assume the associated risks, if you are at all unsure. We are not under any obligation to update any such material. Any opinion made may be personal to the author and may not reflect the opinion of StoneX Europe Ltd.