





Silver and Gold beginning to shine again XAUUSD XAGUSD
With current chart patterns, there are opportunities to be long or short precious metals.
Share this:

With a weak US Dollar Index (DXY), which is currently sitting near the year’s low of 90.43 , one would expect precious metals to be near their yearly highs. After all, the traditional relationship is that a weaker US Dollar is correlated with higher precious metals , an inverse relationship. That is not always the case. And with the current chart patterns, there are opportunities to be long or short precious metals, with setups dependent on your timeframe:
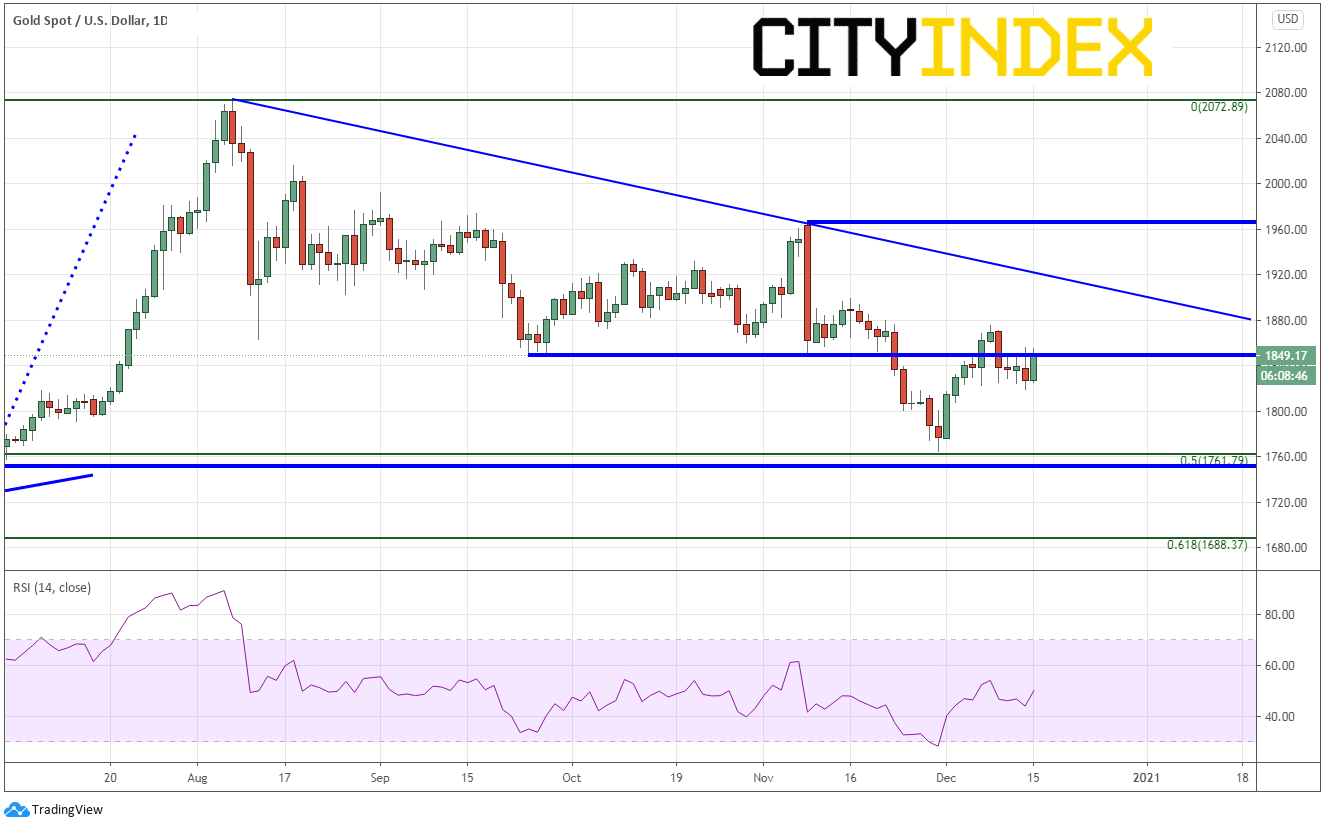
XAU/USD (spot gold) has been moving lower with the US Dollar since August 7th. The yellow metal reached a high of 2075 on that date, before rolling over and pulling back to the 50% retracement level from the March 20th lows to the August 7th highs, near 1764 on November 30th. The pair bounced and is trying to take out horizontal resistance near 1855. If price breaks above, it could easily run to the downward sloping trendline of the recent highs near 1920. Horizontal resistance comes in above there near 1965.50.
Source: Tradingview, City Index
However, on a 60-minute chart of the same timeframe, Gold appears to be formatting a heading and shoulders (green lines), however with a possible extended right shoulder (blue line). The neckline extends up towards 1855/1860. If price were to push above that there, the pattern would be invalidated. Notice the RSI is flirting with overbought levels while price is near 1850. Shorts are looking to enter near the current market price. Support is at yesterday’s low near 1818. The target for the head and shoulders pattern is near 1800. The is additional horizontal support from the lows of November 30th near 1763.
Source: Tradingview, City Index
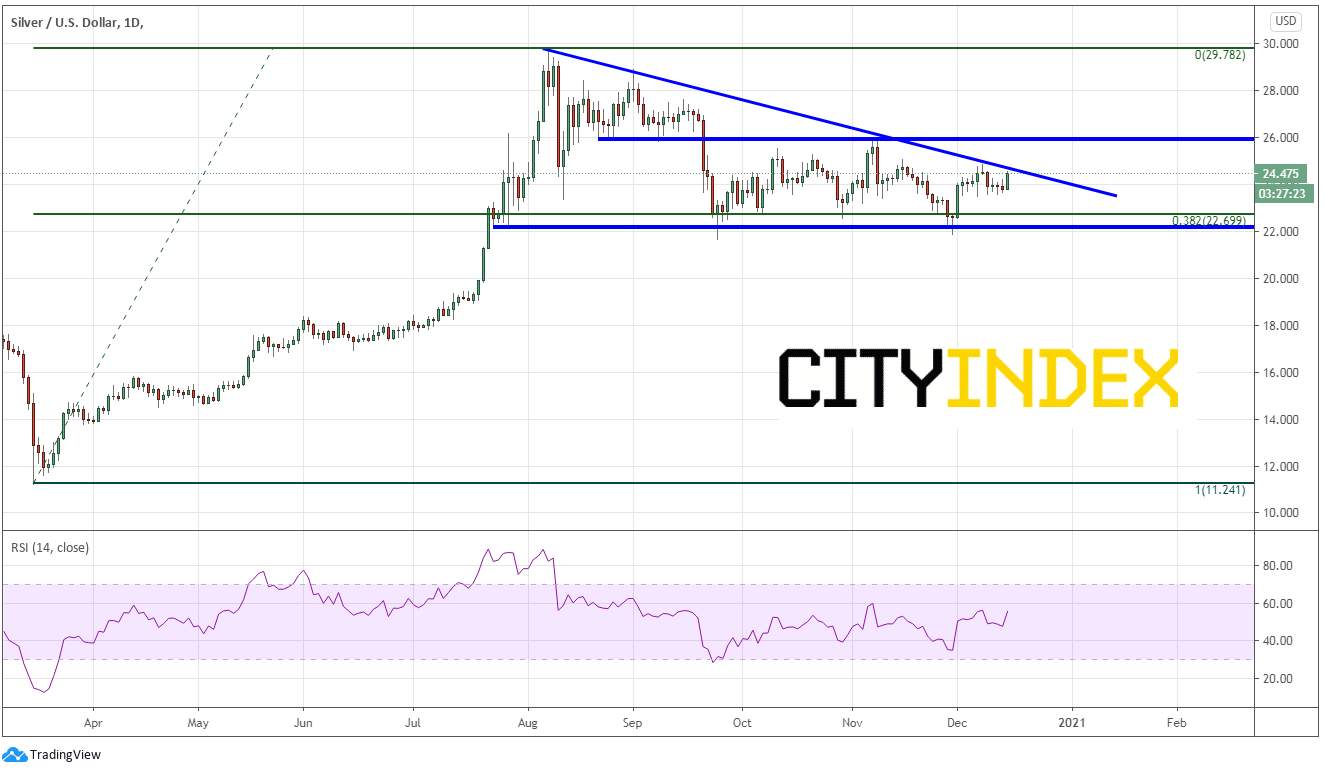
XAU/USD (spot silver) has also been moving lower with the US Dollar since early August. Silver reached a high of 29.90 on August 7th, before pulling back to only the 38.2% Fibonacci retracement from the March 16th lows to the August 7th highs, near 21.64 on September 24th and November 30th. The precious metal then bounced and is trying to take above the downward sloping trendline from the highs near 24.40. If price breaks above, it could run to horizontal resistance and November 26th highs near 26.00. Above there, resistance is all the way up at the August 7th highs!
Source: Tradingview, City Index
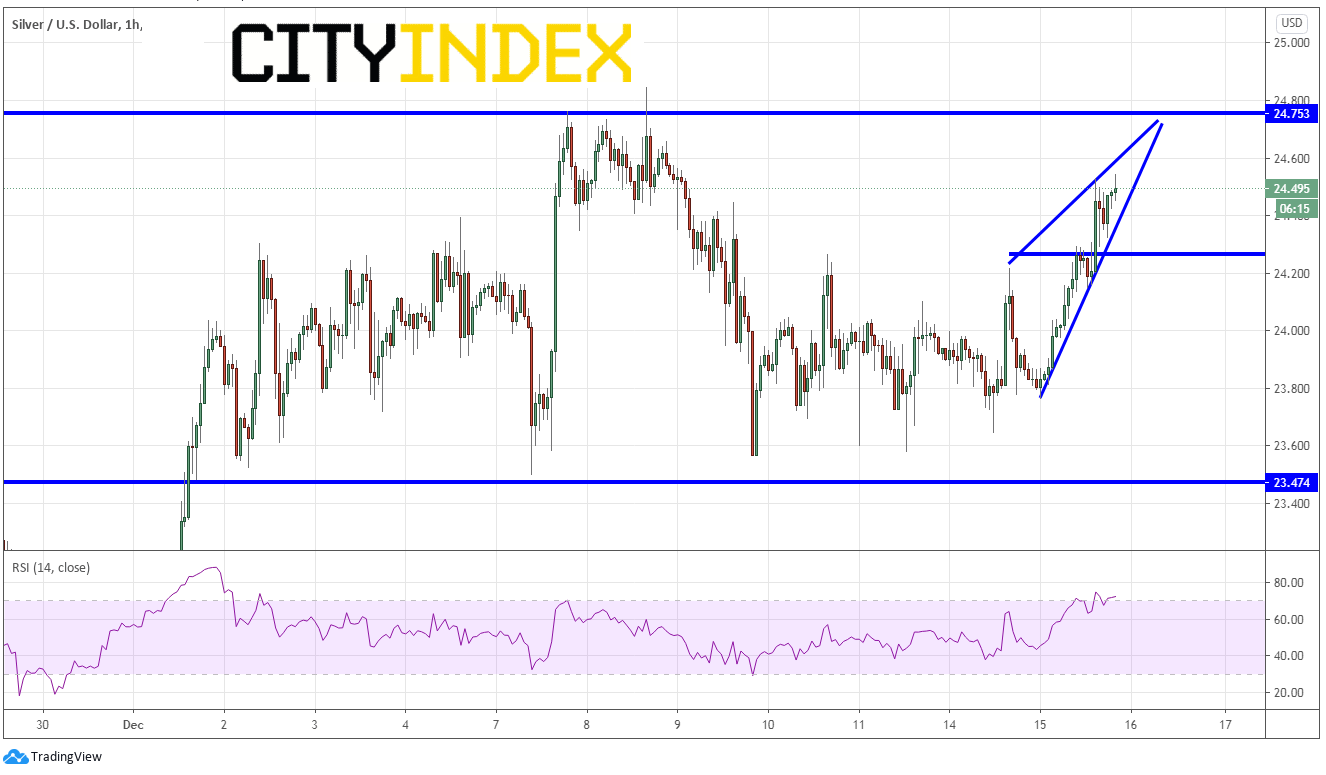
On a 60-minute chart of the same timeframe, Silver has been trading in a channel since December 1st between 23.53 and 24.84. Currently, the precious metal is forming an ascending wedge formation, and is expectations are that ascending wedges will break lower. The target for and ascending wedge is a 100% retracement. If price were to push above 24.75, the pattern would be invalidated. Notice the RSI is flirting with overbought levels while price is near 1850. 24.50. First horizontal support is the December 14th highs near 24.12. A break below should move quickly to the target are near 23.76. Additional horizontal support is at the bottom channel trendline near 23.50.
Source: Tradingview, City Index
The longer-term daily timeframe appears as though precious metals are on a path higher. However, there are opportunities for short-term trades along the way from which to profit.
Learn more about gold and silver trading opportunities.
With a weak US Dollar Index (DXY), which is currently sitting near the year’s low of 90.43 , one would expect precious metals to be near their yearly highs. After all, the traditional relationship is that a weaker US Dollar is correlated with higher precious metals , an inverse relationship. That is not always the case. And with the current chart patterns, there are opportunities to be long or short precious metals, with setups dependent on your timeframe:
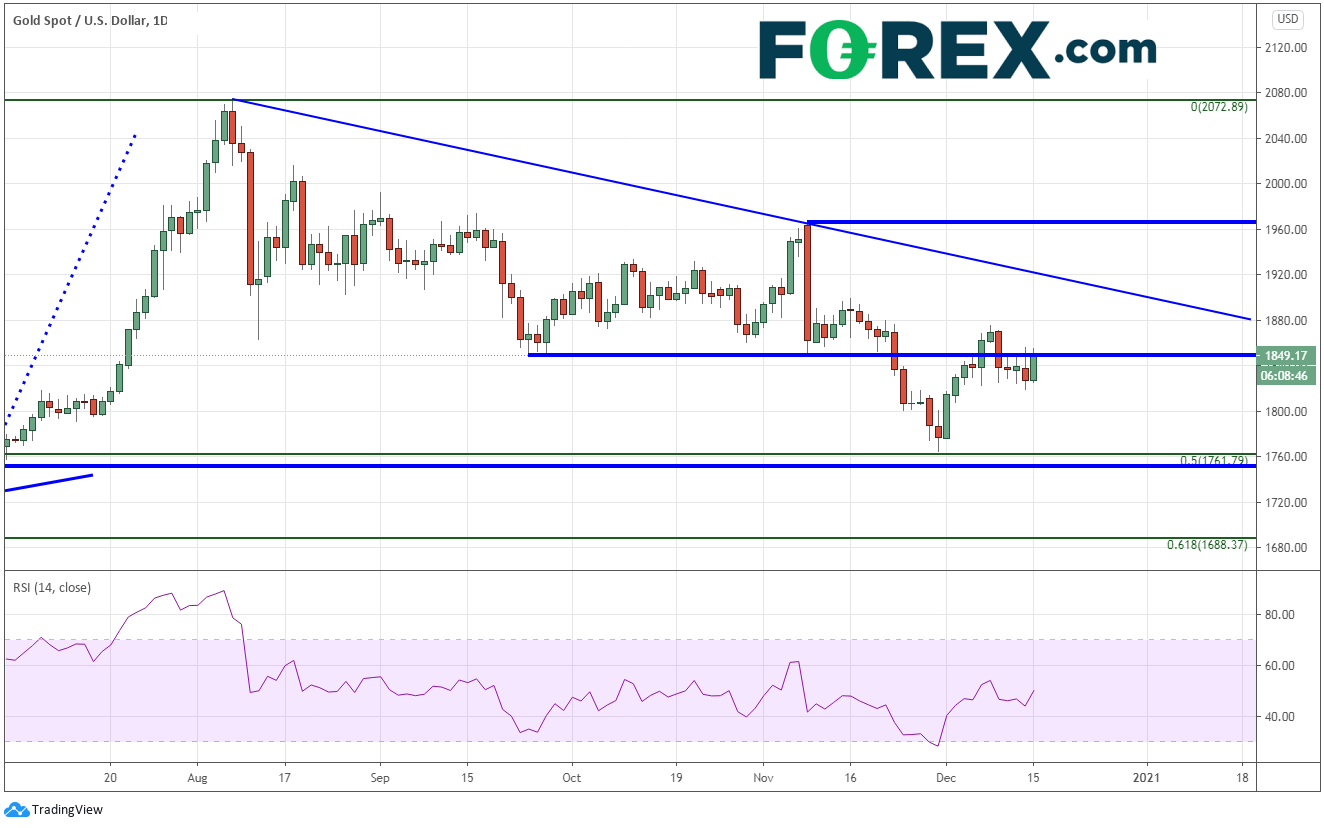
XAU/USD (spot gold) has been moving lower with the US Dollar since August 7th. The yellow metal reached a high of 2075 on that date, before rolling over and pulling back to the 50% retracement level from the March 20th lows to the August 7th highs, near 1764 on November 30th. The pair bounced and is trying to take out horizontal resistance near 1855. If price breaks above, it could easily run to the downward sloping trendline of the recent highs near 1920. Horizontal resistance comes in above there near 1965.50.
Source: Tradingview, FOREX.com
However, on a 60-minute chart of the same timeframe, Gold appears to be formatting a heading and shoulders (green lines), however with a possible extended right shoulder (blue line). The neckline extends up towards 1855/1860. If price were to push above that there, the pattern would be invalidated. Notice the RSI is flirting with overbought levels while price is near 1850. Shorts are looking to enter near the current market price. Support is at yesterday’s low near 1818. The target for the head and shoulders pattern is near 1800. The is additional horizontal support from the lows of November 30th near 1763.
Source: Tradingview, FOREX.com
XAU/USD (spot silver) has also been moving lower with the US Dollar since early August. Silver reached a high of 29.90 on August 7th, before pulling back to only the 38.2% Fibonacci retracement from the March 16th lows to the August 7th highs, near 21.64 on September 24th and November 30th. The precious metal then bounced and is trying to take above the downward sloping trendline from the highs near 24.40. If price breaks above, it could run to horizontal resistance and November 26th highs near 26.00. Above there, resistance is all the way up at the August 7th highs!
Source: Tradingview, FOREX.com
On a 60-minute chart of the same timeframe, Silver has been trading in a channel since December 1st between 23.53 and 24.84. Currently, the precious metal is forming an ascending wedge formation, and is expectations are that ascending wedges will break lower. The target for and ascending wedge is a 100% retracement. If price were to push above 24.75, the pattern would be invalidated. Notice the RSI is flirting with overbought levels while price is near 1850. 24.50. First horizontal support is the December 14th highs near 24.12. A break below should move quickly to the target are near 23.76. Additional horizontal support is at the bottom channel trendline near 23.50.
Source: Tradingview, FOREX.com
The longer-term daily timeframe appears as though precious metals are on a path higher. However, there are opportunities for short-term trades along the way from which to profit.
Learn more about gold and silver trading opportunities.


The complete CFD trading experience
Award-winning platforms, competitive spreads, low commissions and dedicated support.
We live and breathe the markets and are dedicated to helping traders realise their ambitions as we continue to set the industry bar.
Economic calendar
Web Trader platform
Our sophisticated web-based platform is packed with features.
Related articles

NZD/USD pressure mounts as payrolls looms large
NZD/USD has fallen sharply as Fed rate expectations reset higher, but extreme downside stretch and major support raise the risk of a violent counter-trend rebound.

US Core PCE Preview: Stale or Significant for the Fed
Core PCE inflation takes center stage Wednesday, with traders watching for signs of renewed price pressure and clues on whether the Fed could hike again in October.


Gold Forecast: Are Bears Regaining Control of XAU/USD?
The start of the trading week has not been particularly favorable for gold. This can be seen in recent XAU/USD price action, with the metal falling nearly 4.00% over the last two trading sessions and bringing renewed attention to a bearish bias within the market.

StoneX Europe Ltd may make third party material available on this website which may contain information included but not limited to the conditions of financial markets. The material is for information purposes only and does not contain, and should not be construed as containing, investment advice and/or investment recommendation and/or an investment research and/or an offer of or solicitation for any transactions in financial instruments; any decision to enter into a specific transaction shall be made by the client following an assessment by him/her of their situation.
StoneX Europe Ltd makes no representation or warranty and assumes no liability as to the accuracy or completeness of the information provided, nor any loss arising from any investment based on a recommendation, forecast or other information supplied. You should always seek independent advice as to your suitability to speculate in any related markets and your ability to assume the associated risks, if you are at all unsure. We are not under any obligation to update any such material. Any opinion made may be personal to the author and may not reflect the opinion of StoneX Europe Ltd.