


Silver Shock Resets the Trade After Historic Rout
The warning signs were there and silver finally cracked. Now, with volatility surging and momentum reset, the market faces a far tougher question about direction from here.
Share this:

- Silver volatility remains extremely elevated
- $79 key near-term level to watch
- Directional risks now more balanced
Friday’s historic rout in silver has validated the warning signs flagged late last week. What had become a stretched, speculation-heavy rally finally gave way, delivering a violent reset on a scale never seen before.
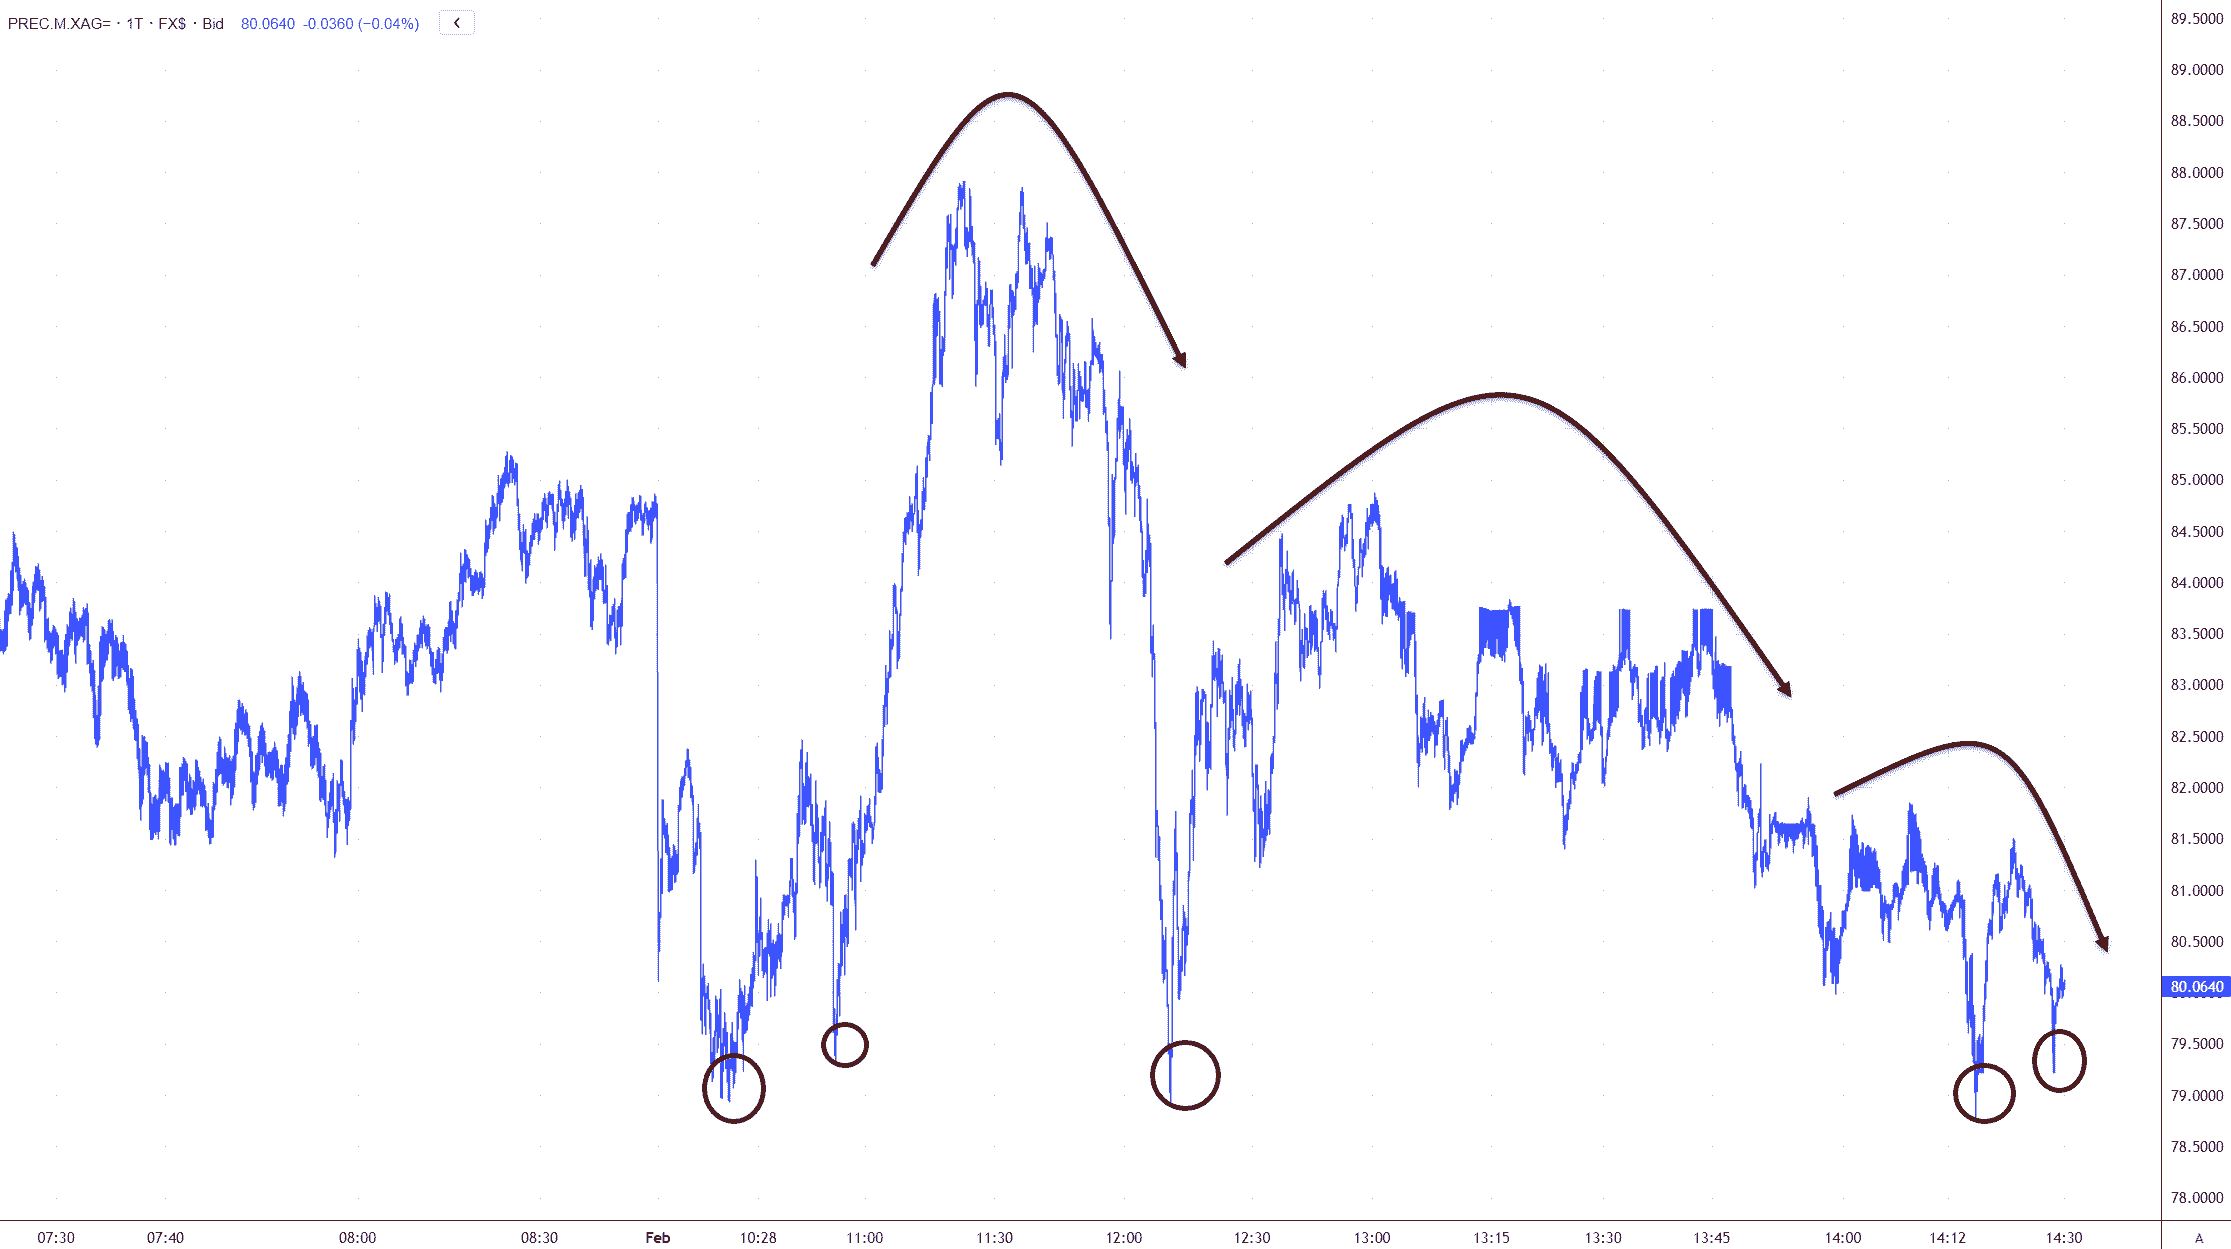
The fallout didn’t end with Friday’s close. Silver gapped lower by around 5% on the open in Asia before volatility surged, with price whipping nearly $10 higher ahead of mainland Chinese markets reopening. While rallies continue to be sold into, one feature stands out on the tick chart: repeated and aggressive buying interest around the $79 level. Five strong bounces have already emerged from that area, making it the key near-term battleground to watch.
Source: LSEG Workstation
Despite those reactions, the broader price action still looks heavy. Directional risks remain skewed to the downside for now, but $79 is clearly where the market is drawing a line, at least in the very short term. A clean break below would likely reopen downside momentum, while continued defence could keep conditions choppy.
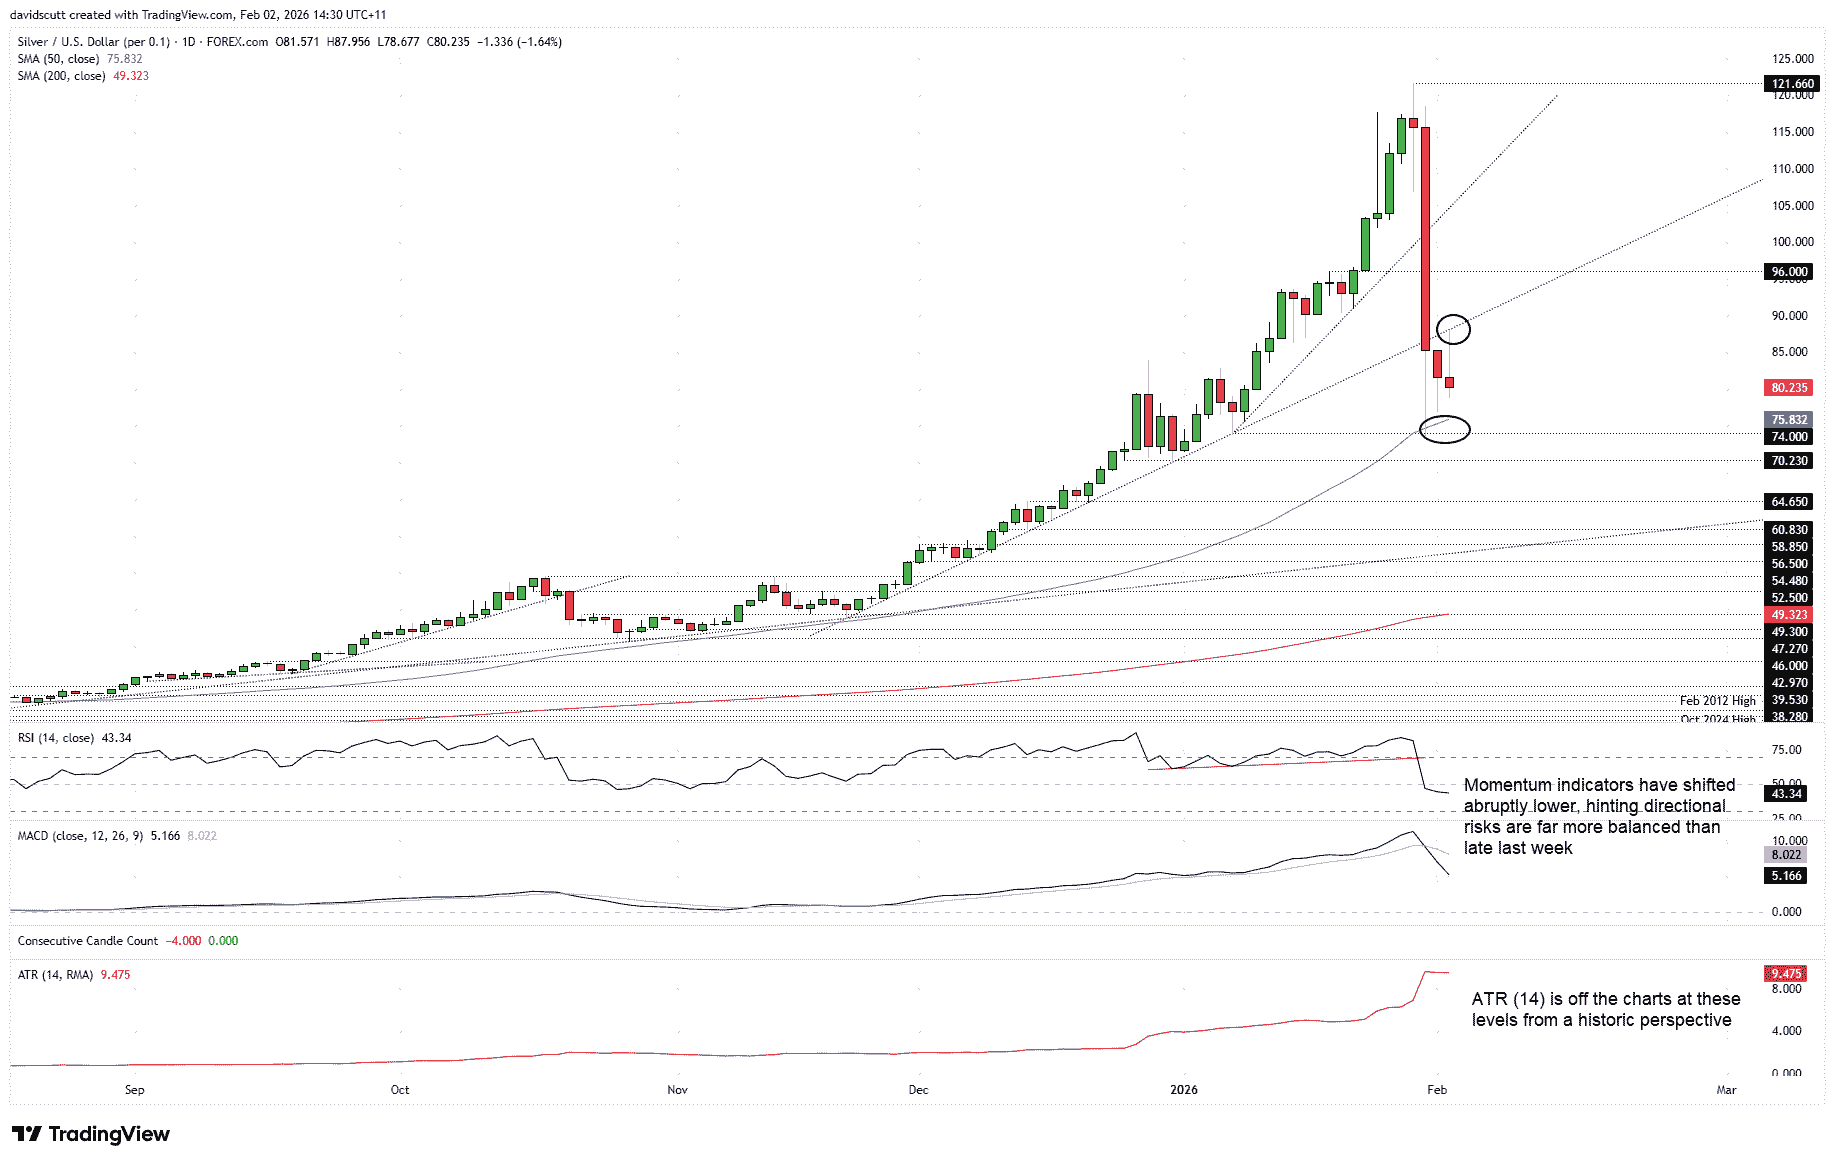
Zooming out to the daily chart reinforces that message. Beneath $79, the next major downside level of note is the 50-day moving average at $75.83, standing out after the price bounced aggressively from beneath it into Friday’s close. Other minor levels are annotated below, but that level is the one to watch should selling pressure intensify.
Source: TradingView
On the topside, an earlier squeeze stalled at the November uptrend found today around $88, the same level where the acceleration in silver’s surge began earlier this year. That makes it the first meaningful resistance to monitor heading into the European session.
Momentum indicators naturally reflect the abrupt shift seen over the past two sessions. RSI (14) has flipped from deeply overbought to below the neutral 50 level, breaking the uptrend that had been in place since late December. MACD has crossed its signal line from above, easing from extreme readings but remaining historically elevated.
From a directional perspective, risks now look far more balanced than they did late last week. Volatility, however, is anything but normal. ATR (14) is sitting at 9.475, an extraordinary reading for a metal that was trading below $40 just six months ago. The message is clear: the easy part of the move looks to be over, with patience now key when assessing whether to position for an extended bear trend or a meaningful bullish retracement.
Latest market news




The complete CFD trading experience
Award-winning platforms, competitive spreads, low commissions and dedicated support.
We live and breathe the markets and are dedicated to helping traders realise their ambitions as we continue to set the industry bar.
Economic calendar
Web Trader platform
Our sophisticated web-based platform is packed with features.
Related articles
EUR/USD, USD/JPY Outlook: Oil, yields and an FX identity crisis
Crude oil is setting the tone across rates and FX, leaving EUR/USD vulnerable and USD/JPY caught between higher Treasury yields and the growing threat of intervention
Gold forecast: Rising yields become too hot for gold, but the outlook is far from bearish
Gold and silver prices took a plunge today, with the former down 3% and the latter falling some 5% by mid European session, before bouncing off their lows. The losses come after the metals remained largely supported until last week, despite the big dollar rally and surging bond yields as we have seen in recent weeks. But it simply got too much, and the metals succumbed to pressure today.


AUD/USD forecast: Currency Pair of the Week | September 28, 2026
The week has started with stocks, gold, silver and bitcoin all falling, as crude oil rebounded and bond yields pushed further higher. Trump refusing to agree to Tehran’s proposal to re-open the Strait of Hormuz has left the markets disappointed. Still, reports that mediators are expected to hold talks with the two sides on an amended version of the 7-day proposal that Iran presented, keeps hopes alive that we may see some progress.
StoneX Europe Ltd may make third party material available on this website which may contain information included but not limited to the conditions of financial markets. The material is for information purposes only and does not contain, and should not be construed as containing, investment advice and/or investment recommendation and/or an investment research and/or an offer of or solicitation for any transactions in financial instruments; any decision to enter into a specific transaction shall be made by the client following an assessment by him/her of their situation.
StoneX Europe Ltd makes no representation or warranty and assumes no liability as to the accuracy or completeness of the information provided, nor any loss arising from any investment based on a recommendation, forecast or other information supplied. You should always seek independent advice as to your suitability to speculate in any related markets and your ability to assume the associated risks, if you are at all unsure. We are not under any obligation to update any such material. Any opinion made may be personal to the author and may not reflect the opinion of StoneX Europe Ltd.