






South African Rand Hits Record Low
Moodys cut the country’s rating to junk and kept the outlook negative.
Share this:

The South African Rand fell to 18.05 vs US Dollar as Moodys cut the country’s rating to junk, one level below investment grade, and kept the outlook negative. This is the first time the USD/ZAR as ever been above 18.00. Moodys joined S&P and Fitch with ratings below investment grade for South Africa. The ratings firm discussed a “continuing deterioration in fiscal strength and structurally very weak growth”. The downgrade came after South Africa began a three-week country lockdown to try and stop the spread of the coronavirus.
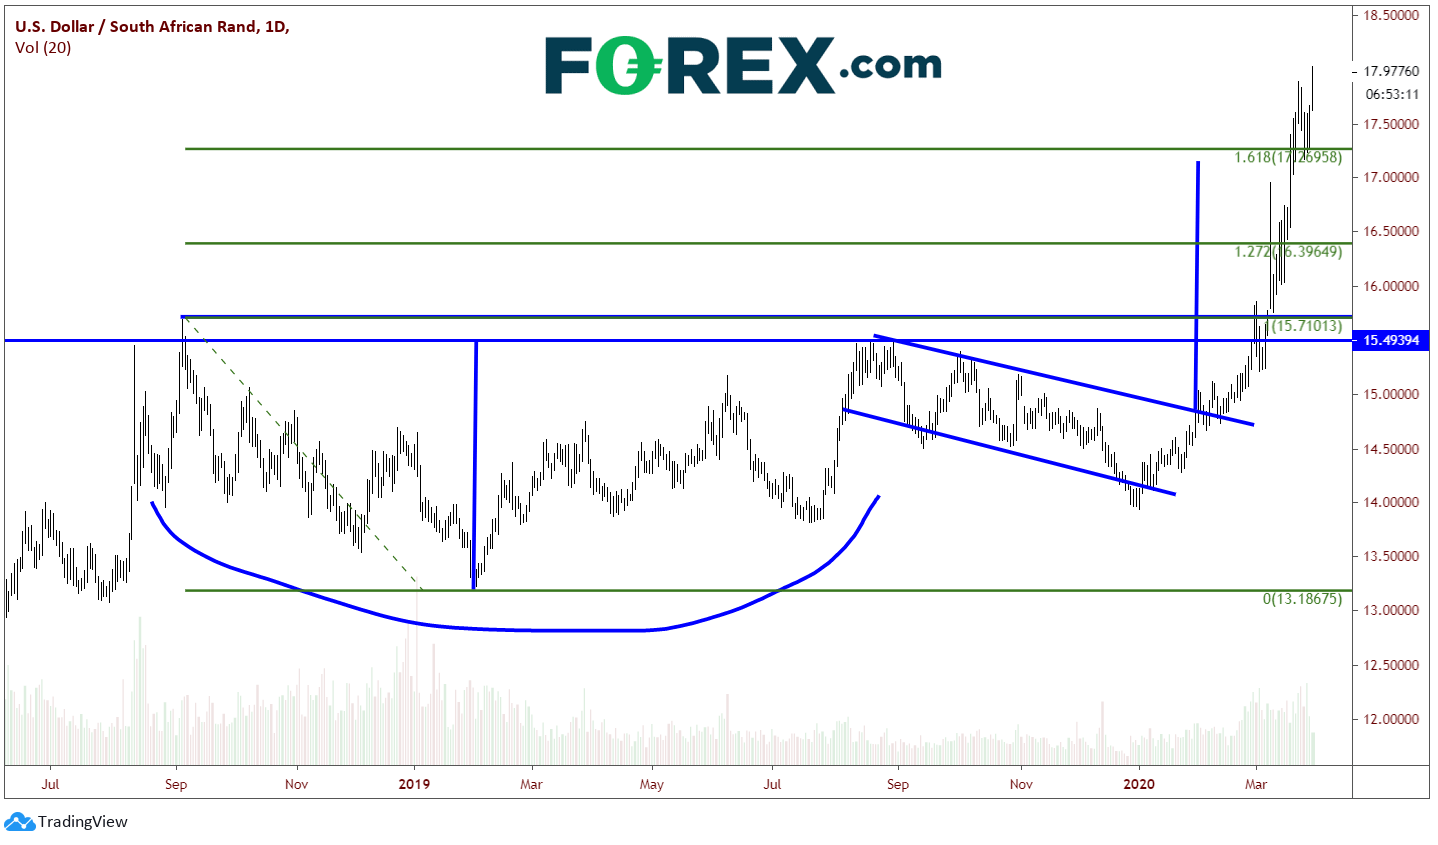
USD/ZAR was in a cup-and-handle formation on a daily timeframe since September 2018, breaking out of the handle in early February. The target for a cup-and-handle formation is the depth of the cup, added to the breakout level from the handle, near 17.15. The emerging market pair reached its target in mid-March, as well as, the 161.8% extension level from the highs on September 15th, 2018 to the lows of February 1, 2019 at 17.25. With the break above 18.00 today, the pair broke its previous all-time highs last week near 17.88.
Source: Tradingview, City Index
On a 240-minute time frame, although it looks like the sky is the limit for USD/ZAR, the pair is currently putting in a 3-drive pattern, in which the price makes 3 higher highs and the RSI makes 3 lower highs. This is an indication of a possible reversal in price. In addition, the pair has formed a rising wedge formation, however it still is in the middle of the wedge and doesn’t seem to be breaking down anytime soon. Bulls will be looking to buy dips between horizontal support at 17.60, down to the rising trendline of the wedge near 17.45. Below that, support crosses near the 161.8% retracement level (now acting as support) near 17.25. Resistance is near the top trendline of the rising wedge at 18.30. As this is all-time new highs, it is difficult to find the next resistance however the Fibonacci extension of 261.8% is 19.82.
Source: Tradingview, City Index
As the coronavirus continues to spread throughout the world, many emerging market countries will also need to “lockdown”. Many of these countries were already in economic trouble, and the coronavirus couldn’t have come at a worse time. As funds flow into the US Dollar and out of less stable economies, such as South Africa, watch for a continued move lower in emerging market currencies vs the US Dollar (ie USD/ZAR higher)
The South African Rand fell to 18.05 vs US Dollar as Moodys cut the country’s rating to junk, one level below investment grade, and kept the outlook negative. This is the first time the USD/ZAR as ever been above 18.00. Moodys joined S&P and Fitch with ratings below investment grade for South Africa. The ratings firm discussed a “continuing deterioration in fiscal strength and structurally very weak growth”. The downgrade came after South Africa began a three-week country lockdown to try and stop the spread of the coronavirus.
USD/ZAR was in a cup-and-handle formation on a daily timeframe since September 2018, breaking out of the handle in early February. The target for a cup-and-handle formation is the depth of the cup, added to the breakout level from the handle, near 17.15. The emerging market pair reached its target in mid-March, as well as, the 161.8% extension level from the highs on September 15th, 2018 to the lows of February 1, 2019 at 17.25. With the break above 18.00 today, the pair broke its previous all-time highs last week near 17.88.
Source: Tradingview, FOREX.com
On a 240-minute time frame, although it looks like the sky is the limit for USD/ZAR, the pair is currently putting in a 3-drive pattern, in which the price makes 3 higher highs and the RSI makes 3 lower highs. This is an indication of a possible reversal in price. In addition, the pair has formed a rising wedge formation, however it still is in the middle of the wedge and doesn’t seem to be breaking down anytime soon. Bulls will be looking to buy dips between horizontal support at 17.60, down to the rising trendline of the wedge near 17.45. Below that, support crosses near the 161.8% retracement level (now acting as support) near 17.25. Resistance is near the top trendline of the rising wedge at 18.30. As this is all-time new highs, it is difficult to find the next resistance however the Fibonacci extension of 261.8% is 19.82.
Source: Tradingview, FOREX.com
As the coronavirus continues to spread throughout the world, many emerging market countries will also need to “lockdown”. Many of these countries were already in economic trouble, and the coronavirus couldn’t have come at a worse time. As funds flow into the US Dollar and out of less stable economies, such as South Africa, watch for a continued move lower in emerging market currencies vs the US Dollar (ie USD/ZAR higher)
Latest market news




The complete CFD trading experience
Award-winning platforms, competitive spreads, low commissions and dedicated support.
We live and breathe the markets and are dedicated to helping traders realise their ambitions as we continue to set the industry bar.
Economic calendar
Web Trader platform
Our sophisticated web-based platform is packed with features.
Related articles
Euro Forecast: EUR/USD Tumbles Towards Yearly Low as Daily RSI Goes Oversold
EUR/USD has been hit hard in the final month of the quarter as USD strength has shown up in a big way. With the pair set to challenge its yearly low as RSI has pushed into oversold territory, is there a chance for a pullback with some big headline risk hitting in the US over the next few days?
AUD/USD outlook: Aussie slips despite hawkish RBA ahead of key data
The AUD/USD was unable to benefit from the Reserve Bank of Australia’s 25-basis-point rate hike overnight. The RBA lifted the cash rate to 4.60%, in line with expectations. However, the Australian dollar weakened following the decision, with much of the Bank’s hawkish stance seemingly priced in ahead of the announcement. The US dollar has also remained largely supported following the recent turmoil in the bond markets.

Canadian Dollar Technical Outlook: USD/CAD Seven-Day Rally Tests Major Resistance 9 29 2026
USD/CAD is pressing into a major technical barrier after an extended advance, raising the risk for price inflection as momentum stretches.

StoneX Europe Ltd may make third party material available on this website which may contain information included but not limited to the conditions of financial markets. The material is for information purposes only and does not contain, and should not be construed as containing, investment advice and/or investment recommendation and/or an investment research and/or an offer of or solicitation for any transactions in financial instruments; any decision to enter into a specific transaction shall be made by the client following an assessment by him/her of their situation.
StoneX Europe Ltd makes no representation or warranty and assumes no liability as to the accuracy or completeness of the information provided, nor any loss arising from any investment based on a recommendation, forecast or other information supplied. You should always seek independent advice as to your suitability to speculate in any related markets and your ability to assume the associated risks, if you are at all unsure. We are not under any obligation to update any such material. Any opinion made may be personal to the author and may not reflect the opinion of StoneX Europe Ltd.