




Stocks: Cracks starting to appear after big recovery
The list of worries for investors grow larger...
Share this:

As we mentioned the possibility in at least two of our report the day before, the stock market recovery was at risk of a reversal. Lo and behold, we have seen a sharp sell-off today, led by the German DAX index with a fall of nearly 2%. US markets have opened sharply lower after future skidded along with their European peers. They could extend their losses in the event the FOMC’s last meeting minutes, due for release later, reveal a more hawkish-than-expected Fed.
Insofar as today’s stock market drop is concerned, there was no obvious single trigger behind the sell-off, although that big inflation print in the UK did little to calm investor concerns about stagflation. Earlier in the week, we had another very poor ZEW survey reading from Germany, where concerns are growing that that additional energy costs for households and businesses will weaken an already struggling economy in the months ahead. Indeed, it is progressively becoming difficult for investors to justify maintaining an optimistic view on the stock markets given a challenging global macro-outlook. This was evidenced, for example, by a poor Empire Fed Manufacturing Index print and weak Chinese industrial and retail sales data on Monday, reminding us that it is not just Eurozone that is struggling for growth.
Against this backdrop, today’s sell-off should surprise no one.
Russell back below 200-day is a bearish signal
As per our analysis in the Technical Tuesday report (which we publish and update the same link every week), US indices have indeed turned around, with the S&P finding strong resistance from the 200-day moving average. With a not-so-great macro backdrop, we were always going to get at least some long-side profit-taking around these levels. But if the weakness holds into the close, then this will likely lead to further follow-up technical selling in the days ahead.
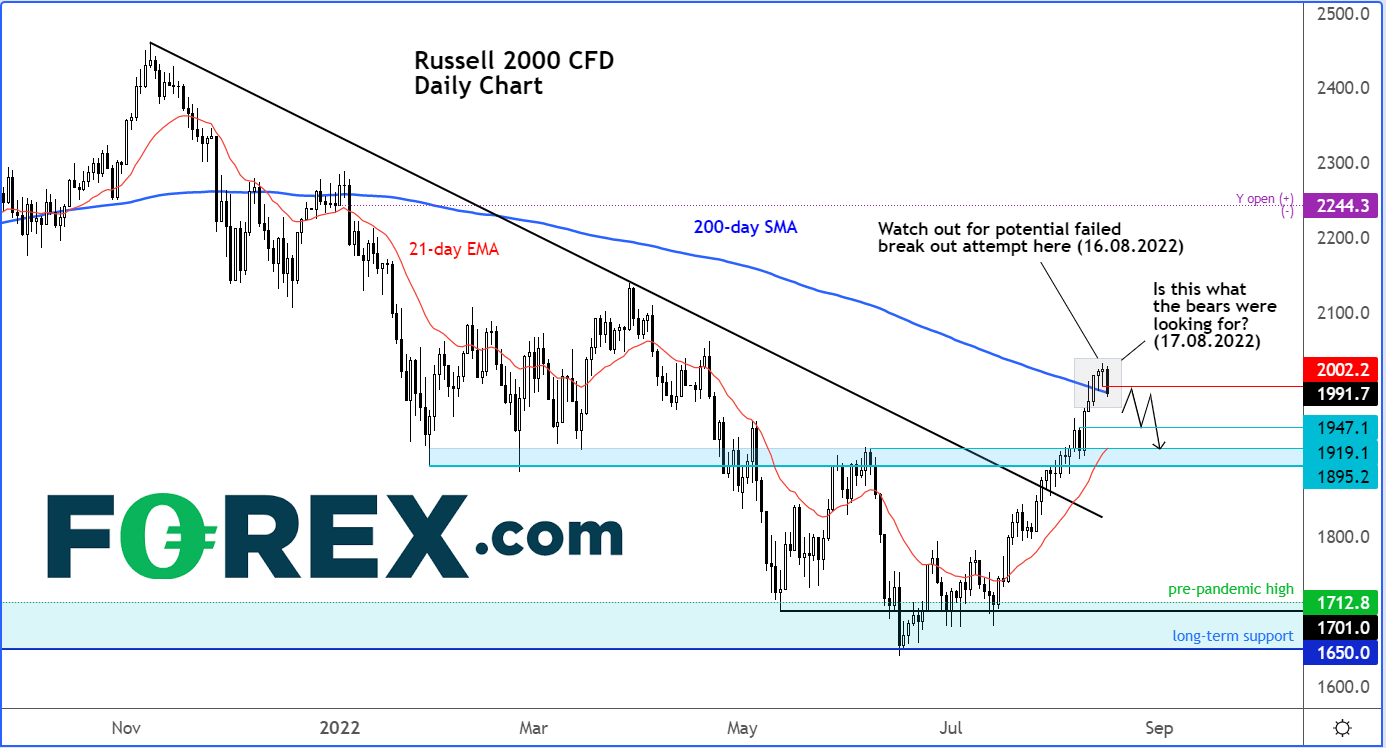
Along with the SPX, it is worth watching the Russell as well, for it has – for now – refused to hold above its 200-day average, which looks like a typical failed breakout scenario. A close around current levels or lower would be considered bearish.
How to trade with City Index
You can trade with City Index by following these four easy steps:
- Open an account, or log in if you’re already a customer
• Open an account in the UK
• Open an account in Australia
• Open an account in Singapore
- Search for the company you want to trade in our award-winning platform
- Choose your position and size, and your stop and limit levels
- Place the trade
As we mentioned the possibility in at least two of our report the day before, the stock market recovery was at risk of a reversal. Lo and behold, we have seen a sharp sell-off today, led by the German DAX index with a fall of nearly 2%. US markets have opened sharply lower after future skidded along with their European peers. They could extend their losses in the event the FOMC’s last meeting minutes, due for release later, reveal a more hawkish-than-expected Fed.
Insofar as today’s stock market drop is concerned, there was no obvious single trigger behind the sell-off, although that big inflation print in the UK did little to calm investor concerns about stagflation. Earlier in the week, we had another very poor ZEW survey reading from Germany, where concerns are growing that that additional energy costs for households and businesses will weaken an already struggling economy in the months ahead. Indeed, it is progressively becoming difficult for investors to justify maintaining an optimistic view on the stock markets given a challenging global macro-outlook. This was evidenced, for example, by a poor Empire Fed Manufacturing Index print and weak Chinese industrial and retail sales data on Monday, reminding us that it is not just Eurozone that is struggling for growth.
Against this backdrop, today’s sell-off should surprise no one.
Russell back below 200-day is a bearish signal
As per our analysis in the Technical Tuesday report (which we publish and update the same link every week), US indices have indeed turned around, with the S&P finding strong resistance from the 200-day moving average. With a not-so-great macro backdrop, we were always going to get at least some long-side profit-taking around these levels. But if the weakness holds into the close, then this will likely lead to further follow-up technical selling in the days ahead.
Along with the SPX, it is worth watching the Russell as well, for it has – for now – refused to hold above its 200-day average, which looks like a typical failed breakout scenario. A close around current levels or lower would be considered bearish.
How to trade with FOREX.com
Follow these easy steps to start trading with FOREX.com today:
- Open a Forex.com account, or log-in if you’re already a customer.
- Search for the pair you want to trade in our award-winning platform.
- Choose your position and size, and your stop and limit levels.
- Place the trade.




The complete CFD trading experience
Award-winning platforms, competitive spreads, low commissions and dedicated support.
We live and breathe the markets and are dedicated to helping traders realise their ambitions as we continue to set the industry bar.
Economic calendar
Web Trader platform
Our sophisticated web-based platform is packed with features.
Related articles
Russell 2000 breaks 200-day average as CPI risk looms
US small caps have lost nearly 9% since August, with surging Treasury yields overwhelming a historically favourable midterm trading period. Now the Russell 2000 is threatening to break a major support zone ahead of US CPI.

Japanese Yen Short-term Outlook: USD/JPY Breakout Risk Builds Below 200-Day Average 10 13 2026
USD/JPY is trading in a narrow range beneath major resistance ahead of CPI, with the next breakout likely to set the near-term directional tone.


USD/JPY forecast: Dollar remains fundamentally supported ahead of CPI
The USD/JPY eased lower today with the greenback also declining against several other currencies. However, at the time of writing, oil prices were bouncing back and yields were off their lows again. The US dollar hadn’t moved much yet, but these forces could help it to regain its poise ahead of the release of US CPI on Wednesday.
StoneX Europe Ltd may make third party material available on this website which may contain information included but not limited to the conditions of financial markets. The material is for information purposes only and does not contain, and should not be construed as containing, investment advice and/or investment recommendation and/or an investment research and/or an offer of or solicitation for any transactions in financial instruments; any decision to enter into a specific transaction shall be made by the client following an assessment by him/her of their situation.
StoneX Europe Ltd makes no representation or warranty and assumes no liability as to the accuracy or completeness of the information provided, nor any loss arising from any investment based on a recommendation, forecast or other information supplied. You should always seek independent advice as to your suitability to speculate in any related markets and your ability to assume the associated risks, if you are at all unsure. We are not under any obligation to update any such material. Any opinion made may be personal to the author and may not reflect the opinion of StoneX Europe Ltd.