




Tesla hits technical target at 610vtraders may look to buy on dips
Readers could consider buying on short-term dips as long as the 50-day EMA continues to provide support
Share this:

For those who follow such things, the “World’s Richest People” list has seen a dramatic shakeup this year. Many of the familiar names (Bezos, Gates, Arnault, Zuckerberg, Buffett, etc) remain in the Top 10, but Tesla’s eccentric CEO Elon Musk has seen his wealth balloon to nearly $150B on the back of the huge rally in TSLA stock to propel him all the way up to #2 overall. With TSLA (finally) set to be formally added to the S&P 500 before markets open on 21 December, what are the prospects for the hotly-debated electric automaker moving forward?
From a fundamental perspective, Tesla is the quintessential growth stock. In other words, the company has low revenue and profit figures relative to its current price, with traders more focused on the firm’s future prospects and total addressable market. Based on analysts’ estimates for the next twelve months, TSLA sports a P/E ratio of 160 and P/S ratio of 13; by way of comparison, Tesla’s valuation is ~25X higher than the equivalent ratios for General Motors (GM), a far more established and profitable automaker, at 6.7 and 0.5 respectively.
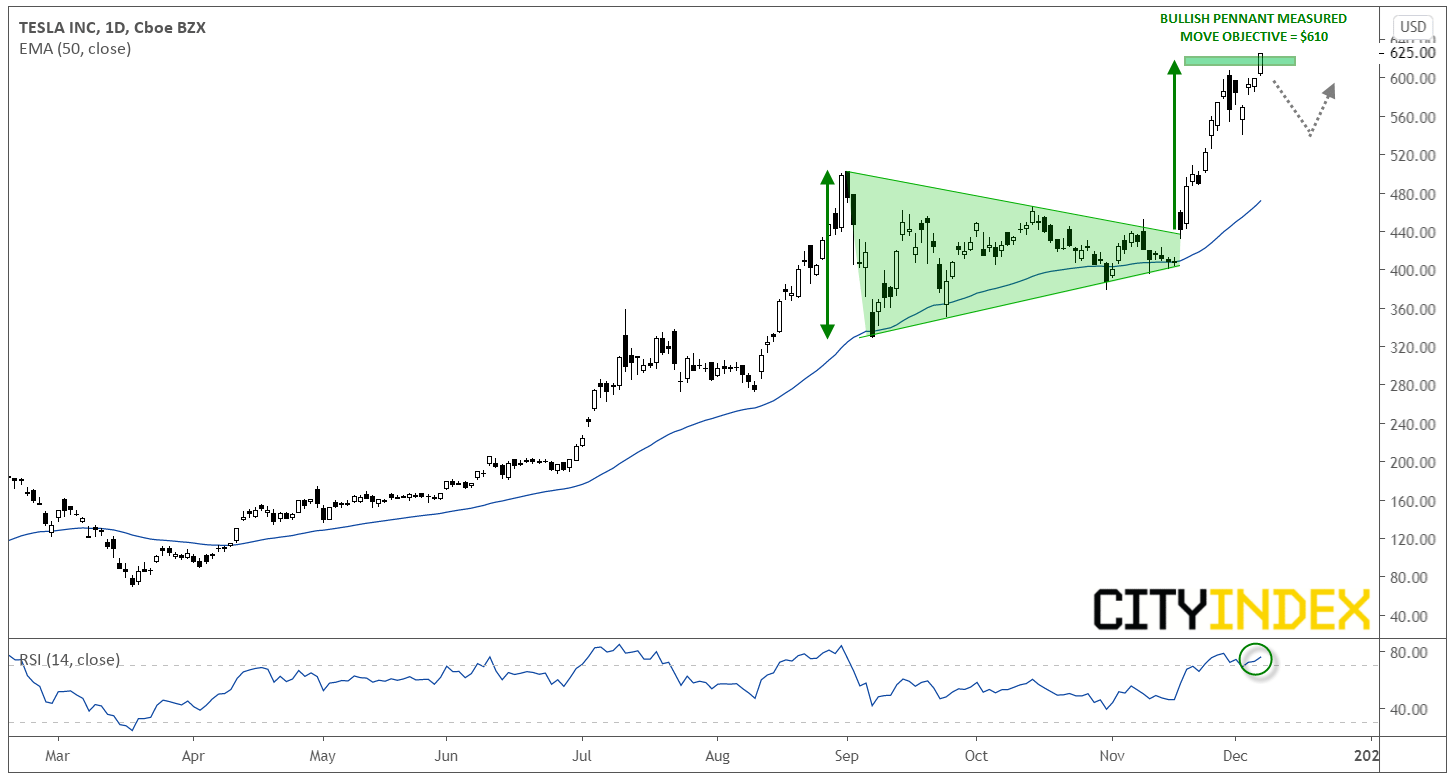
Turning to the chart, the only thing more incredible than Tesla’s sky-high valuation ratios is the strength of its current uptrend. Since bottoming near $70 in mid-March, TSLA has surged nearly 800% to trade above $620. The most relevant technical features of the chart are the 50-day exponential moving average, which has consistently provided support over the past nine months, and the bullish pennant formation from September and October. The mid-November breakout from that pattern created a “measured move” price objective near $610:
Source: TradingView, GAIN Capital
With prices reaching that technical objective this morning and trading well above the 50-day EMA, it wouldn’t be surprising to see the stock pause or pullback into the $500s in the coming days. That said, TSLA remains in a strong uptrend, and with many funds trying to “window dress” their portfolios ahead of end-of-year communications, readers could consider buying on short-term dips as long as the 50-day EMA continues to provide support.
After all, Elon Musk becoming the richest person on the planet seems like an oddly apropos development for the bizarre, unprecedented year we’ve lived through thus far!
For those who follow such things, the “World’s Richest People” list has seen a dramatic shakeup this year. Many of the familiar names (Bezos, Gates, Arnault, Zuckerberg, Buffett, etc) remain in the Top 10, but Tesla’s eccentric CEO Elon Musk has seen his wealth balloon to nearly $150B on the back of the huge rally in TSLA stock to propel him all the way up to #2 overall. With TSLA (finally) set to be formally added to the S&P 500 before markets open on 21 December, what are the prospects for the hotly-debated electric automaker moving forward?
From a fundamental perspective, Tesla is the quintessential growth stock. In other words, the company has low revenue and profit figures relative to its current price, with traders more focused on the firm’s future prospects and total addressable market. Based on analysts’ estimates for the next twelve months, TSLA sports a P/E ratio of 160 and P/S ratio of 13; by way of comparison, Tesla’s valuation is ~25X higher than the equivalent ratios for General Motors (GM), a far more established and profitable automaker, at 6.7 and 0.5 respectively.
Turning to the chart, the only thing more incredible than Tesla’s sky-high valuation ratios is the strength of its current uptrend. Since bottoming near $70 in mid-March, TSLA has surged nearly 800% to trade above $620. The most relevant technical features of the chart are the 50-day exponential moving average, which has consistently provided support over the past nine months, and the bullish pennant formation from September and October. The mid-November breakout from that pattern created a “measured move” price objective near $610:
Source: TradingView, GAIN Capital
With prices reaching that technical objective this morning and trading well above the 50-day EMA, it wouldn’t be surprising to see the stock pause or pullback into the $500s in the coming days. That said, TSLA remains in a strong uptrend, and with many funds trying to “window dress” their portfolios ahead of end-of-year communications, readers could consider buying on short-term dips as long as the 50-day EMA continues to provide support.
After all, Elon Musk becoming the richest person on the planet seems like an oddly apropos development for the bizarre, unprecedented year we’ve lived through thus far!
Related tags:
Latest market news




The complete CFD trading experience
Award-winning platforms, competitive spreads, low commissions and dedicated support.
We live and breathe the markets and are dedicated to helping traders realise their ambitions as we continue to set the industry bar.
Economic calendar
Web Trader platform
Our sophisticated web-based platform is packed with features.
Related articles

Nikkei threatens breakout as tech rebound broadens
Breakouts across the SOX and Nasdaq are being matched by rebounds across Asia, with the Nikkei now threatening to join the move.


S&P 500, Nasdaq 100 Forecast for the Week Ahead
A hawkish Fed and 10-Year Notes on the verge of a push above 5%, yet stocks have so far shrugged off that fear. But can it continue?


Hang Seng Tech rout nears make-or-break zone
The technical damage is clear, but with Hang Seng Tech now deeply stretched and approaching major support, the risk-reward is becoming more two-sided.
StoneX Europe Ltd may make third party material available on this website which may contain information included but not limited to the conditions of financial markets. The material is for information purposes only and does not contain, and should not be construed as containing, investment advice and/or investment recommendation and/or an investment research and/or an offer of or solicitation for any transactions in financial instruments; any decision to enter into a specific transaction shall be made by the client following an assessment by him/her of their situation.
StoneX Europe Ltd makes no representation or warranty and assumes no liability as to the accuracy or completeness of the information provided, nor any loss arising from any investment based on a recommendation, forecast or other information supplied. You should always seek independent advice as to your suitability to speculate in any related markets and your ability to assume the associated risks, if you are at all unsure. We are not under any obligation to update any such material. Any opinion made may be personal to the author and may not reflect the opinion of StoneX Europe Ltd.