



Two trades to watch: EUR/GBP, Tesla
GBP/EUR edges higher with inflation in focus. Tesla reports Q3 earnings after the close.
Share this:

GBP/EUR edges higher with inflation in focus
GBP/EUR is attempting to claw higher after UK CPI inflation missed forecasts. UK CPI printed at 3.1% in September down from 3.1% and short of forecasts of 3.2%. However, this remains well above the BoE’s 2% target.
Eurozone inflation is very much in focus with German PPI expected to show 12.7% YoY rise in September, up from 12% in August.
Eurozone CPI is also due; this is a final revision so potentially not as market moving. Expectations are for 1.9% YoY rise, up from 1.6% in August. ECB speakers will also be in focus.
Any gains in the Euro could be limited owing to the dovish ECB
Where next for EUR/GBP?
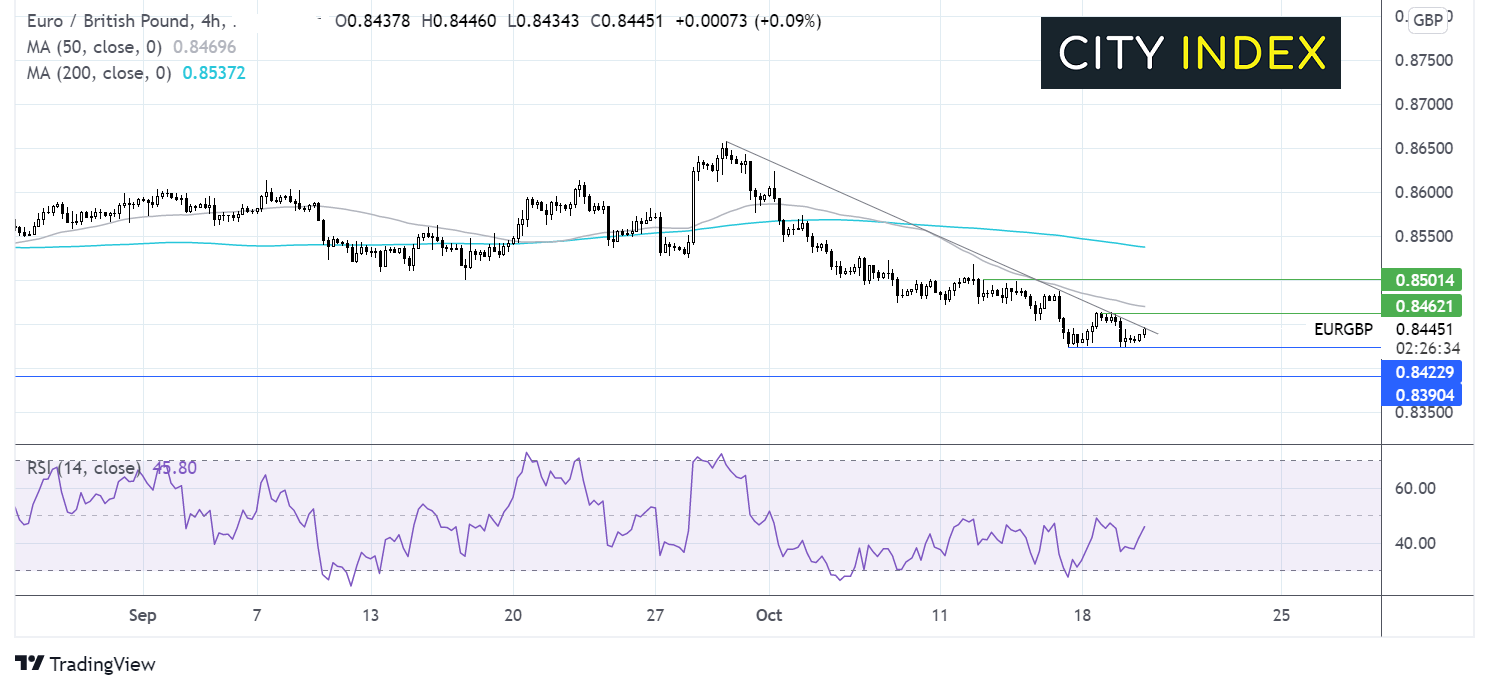
EURGBP trades below its 50 & 200 sma on the 4 hour chart and below its falling trendline dating back to late September. The price has found a floor for now at 0.8423, the October low.
The RSI is pointing higher but remains in bearish territory suggesting that this could be a corrective pick up.
The pair is approaching the falling trendline resistance at 0.8445, bringing the weekly high of 0.8460 into focus and exposing the 50 sma at 0.8465. A move above here would negate the near-term bearish bias. It would take a move above 0.85 horizontal resistance for buyers to gain traction.
Rejection at the trendline resistance could see the pair retest 0.8425 bringing 0.8390 the January ’20 low into play.

Tesla Q3 earnings after the close.
Tesla is due to report after the market close. Tesla has already disclosed deliveries of 241,300 in Q3 a new record, up 20% on the previous quarter.
Thanks to the delivery numbers, revenue is expected at around $14.005 billion.
Whilst Tesla reinvests most of its money into growth, a profit is still expected. EPS is expected at $1.59.
Where next for Tesla share price?
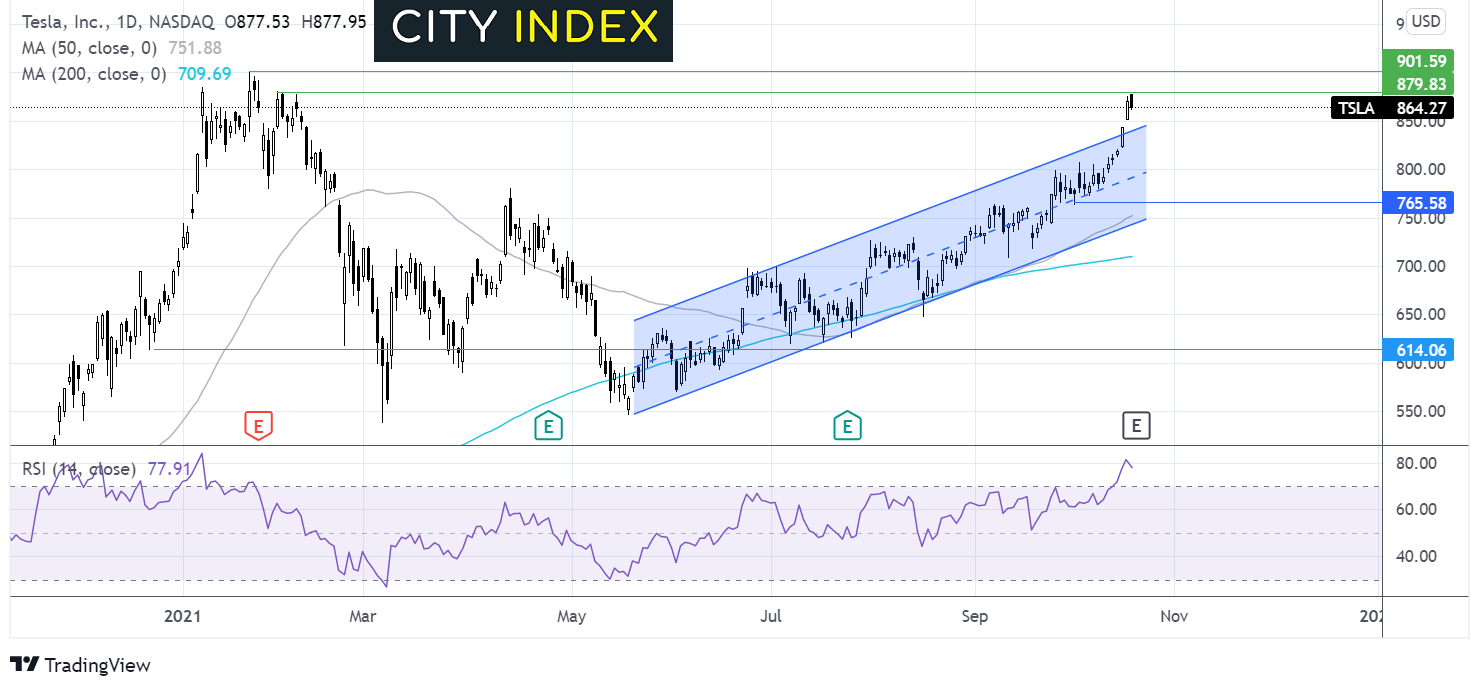
Tesla has broken out of its ascending dating back to mid-May. It trades above its 50 & 200 sma in a clearly bullish chart.
The RSI is firmly in overbought territory some consolidation or an ease back at some point could be on the cards.
Tesla is has been probing a key resistance level at $870 -$880 the February high. A close above this level could cement the way towards $900 amd fresh all-time highs.
Meanwhile, it would take a fall below $765 to change the bullish bias and for bears to gain traction towards $740 the 50 sma and the lower band of the rising channel.
How to trade with City Index
Follow these easy steps to start trading with City Index today:
- Open a City Index account, or log-in if you’re already a customer.
- Search for the market you want to trade in our award-winning platform.
- Choose your position and size, and your stop and limit levels
- Place the trade.
How to trade with FOREX.com
Follow these easy steps to start trading with FOREX.com today:
- Open a Forex.com account, or log-in if you’re already a customer.
- Search for the market you want to trade in our award-winning platform.
- Choose your position and size, and your stop and limit levels.
- Place the trade.
Latest market news




The complete CFD trading experience
Award-winning platforms, competitive spreads, low commissions and dedicated support.
We live and breathe the markets and are dedicated to helping traders realise their ambitions as we continue to set the industry bar.
Economic calendar
Web Trader platform
Our sophisticated web-based platform is packed with features.
Related articles
USD/JPY Q4 2026 Outlook: Hawkish Fed Pricing Clashes With Intervention Risk
The year-end tug-of-war is clear: hawkish Fed pricing supports USD/JPY, while intervention risk limits the upside.
Japanese Yen Forecast: USD/JPY 4% Rally Challenges Post-Intervention Downtrend 9 24 2026
USD/JPY momentum has shifted sharply higher, putting a major resistance confluence in focus as U.S. and Japanese event risk builds.


Oil Quietly Hands the Fed a Reason to Stay Hawkish
Oil prices and the U.S. dollar are both on the front foot as elevated energy costs feed Fed warnings that inflation may prove sticky.

StoneX Europe Ltd may make third party material available on this website which may contain information included but not limited to the conditions of financial markets. The material is for information purposes only and does not contain, and should not be construed as containing, investment advice and/or investment recommendation and/or an investment research and/or an offer of or solicitation for any transactions in financial instruments; any decision to enter into a specific transaction shall be made by the client following an assessment by him/her of their situation.
StoneX Europe Ltd makes no representation or warranty and assumes no liability as to the accuracy or completeness of the information provided, nor any loss arising from any investment based on a recommendation, forecast or other information supplied. You should always seek independent advice as to your suitability to speculate in any related markets and your ability to assume the associated risks, if you are at all unsure. We are not under any obligation to update any such material. Any opinion made may be personal to the author and may not reflect the opinion of StoneX Europe Ltd.