




Two trades to watch EURGBP WTI
Will EUR/GBP finally break through multi-month support as the UK moves to the next stage of re-opening? WTI slips lower as Suez Canal is unblocked.
Share this:

Will EUR/GBP finally break below multi-month lows?
The UK takes another step along the re-opening road with groups of 6 now allowed to meet outside and outdoor sports facilities are also set to reopen.
UK covid cases fall by a third in a week whilst deaths drop 42% to 19. The number of adults vaccinated hits 30 million.
Meanwhile, Europe continues to see cases rise, lockdown restrictions were extended in Germany last week. The vaccine rollout remains sluggish, diverging from the UK.
Where next for EUR/GBP?
EUR/GBP trades below its 200 sma and 50 sma on its 4 hour chart. It has picked up from multi-month lows of 0.8540 however trades with a negative bias.
EUR/GBP continues to test the lower bounds of its recent range 0.8640 – 0.8540 which it has traded in the last 3 weeks.
There is a growing sense that this support is going to give. In doing so, it would open the door to 0.8500 round number and February 7 high. A break through this level could see the bears set their sights on 0.83 low February 18.
On the flip side, any move higher would need to overcome the 50 sma at 0.8590 ahead of the descending trendline resistance at 0.8630 and 0.87 round number.
Learn more about trading forex
WTI slips lower as Suez Canal container is dislodged
Oil slumps in early trade on Monday amid news that the Suez Canal has been dislodged freeing up the vital global trade passage which has been clogged for almost a week.
Oil prices experienced big swings last week as investors weighed up tighter lockdown restrictions against the impact of the Suez Canal blockage.
Investors will look ahead to the OPEC+ meeting on Thursday where the group is expected to maintain lower output levels.
Where next for WTI?
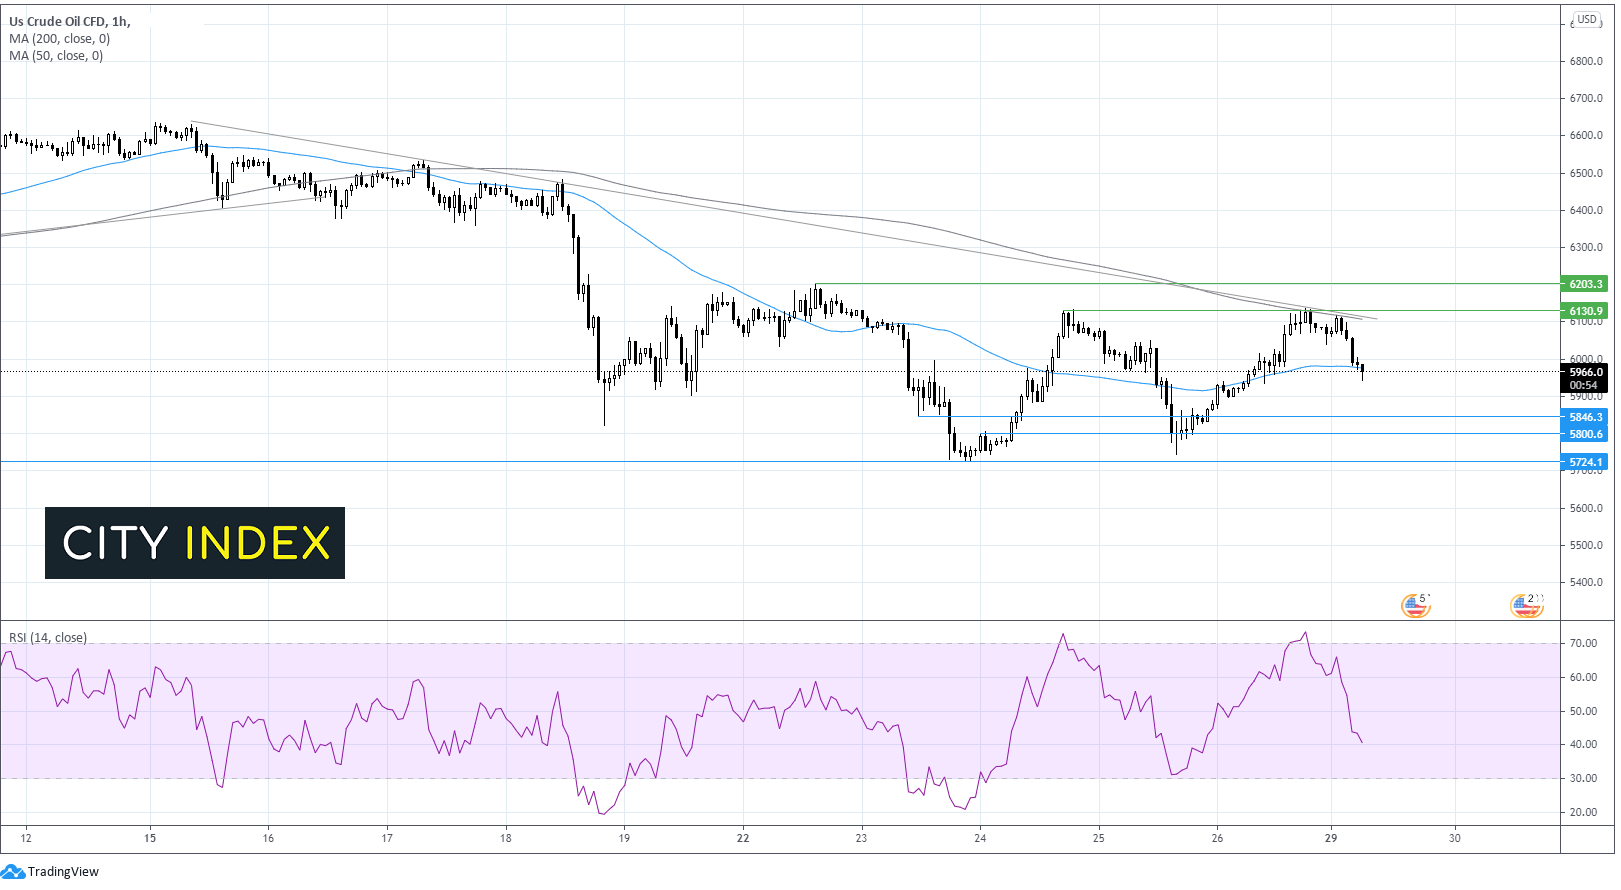
WTI trades lower on Monday, falling through key support at $60 and its 50 sma after failing to break through its 200 hour moving average.
Repeated attempt to break above 200 HMA have failed, furthermore we have seen repeated pullbacks from 61.50/25 over the past 2 weeks indicating weakness in the price around those levels.
The RSI is also supportive of further losses, in negative territory but not oversold.
Support can be seen at 58.60, swing low March 23, before the bears could test round number 58.00 ahead of 57.20 last week’s low.
Any recovery in the price of WTI would need to cross the two week descending trendline and the 200 sma at 61.00, which could prove a tough nut to crack. Beyond there, immediate horizontal resistance at 61.30 could come into play ahead of 62.00 last week’s high.
Will EUR/GBP finally break below multi-month lows?
The UK takes another step along the re-opening road with groups of 6 now allowed to meet outside and outdoor sports facilities are also set to reopen.
UK covid cases fall by a third in a week whilst deaths drop 42% to 19. The number of adults vaccinated hits 30 million.
Meanwhile, Europe continues to see cases rise, lockdown restrictions were extended in Germany last week. The vaccine rollout remains sluggish, diverging from the UK.
Where next for EUR/GBP?
EUR/GBP trades below its 200 sma and 50 sma on its 4 hour chart. It has picked up from multi-month lows of 0.8540 however trades with a negative bias.
EUR/GBP continues to test the lower bounds of its recent range 0.8640 – 0.8540 which it has traded in the last 3 weeks.
There is a growing sense that this support is going to give. In doing so, it would open the door to 0.8500 round number and February 7 high. A break through this level could see the bears set their sights on 0.83 low February 18.
On the flip side, any move higher would need to overcome the 50 sma at 0.8590 ahead of the descending trendline resistance at 0.8630 and 0.87 round number.
Learn more about trading forex
WTI slips lower as Suez Canal container is dislodged
Oil slumps in early trade on Monday amid news that the Suez Canal has been dislodged freeing up the vital global trade passage which has been clogged for almost a week.
Oil prices experienced big swings last week as investors weighed up tighter lockdown restrictions against the impact of the Suez Canal blockage.
Investors will look ahead to the OPEC+ meeting on Thursday where the group is expected to maintain lower output levels.
Where next for WTI?
WTI trades lower on Monday, falling through key support at $60 and its 50 sma after failing to break through its 200 hour moving average.
Repeated attempt to break above 200 HMA have failed, furthermore we have seen repeated pullbacks from 61.50/25 over the past 2 weeks indicating weakness in the price around those levels.
The RSI is also supportive of further losses, in negative territory but not oversold.
Support can be seen at 58.60, swing low March 23, before the bears could test round number 58.00 ahead of 57.20 last week’s low.
Any recovery in the price of WTI would need to cross the two week descending trendline and the 200 sma at 61.00, which could prove a tough nut to crack. Beyond there, immediate horizontal resistance at 61.30 could come into play ahead of 62.00 last week’s high.
Latest market news




The complete CFD trading experience
Award-winning platforms, competitive spreads, low commissions and dedicated support.
We live and breathe the markets and are dedicated to helping traders realise their ambitions as we continue to set the industry bar.
Economic calendar
Web Trader platform
Our sophisticated web-based platform is packed with features.
Related articles
EUR/USD Q4 2026 Outlook: Euro at a Crossroads as Fed, ECB Tighten 9 25 2026
EUR/USD enters Q4 at a pivotal inflection point as competing Fed-ECB policy paths and persistent inflation risks collide with major technical support.
S&P 500 Forecast: SPX rises as oil prices fall, but treasuries remain at multi-decade highs
U.S. stocks are rising on Friday after a volatile week that saw a surge in Treasury yields ripple through financial markets.

USD/JPY Q4 2026 Outlook: Hawkish Fed Pricing Clashes With Intervention Risk
The year-end tug-of-war is clear: hawkish Fed pricing supports USD/JPY, while intervention risk limits the upside.

StoneX Europe Ltd may make third party material available on this website which may contain information included but not limited to the conditions of financial markets. The material is for information purposes only and does not contain, and should not be construed as containing, investment advice and/or investment recommendation and/or an investment research and/or an offer of or solicitation for any transactions in financial instruments; any decision to enter into a specific transaction shall be made by the client following an assessment by him/her of their situation.
StoneX Europe Ltd makes no representation or warranty and assumes no liability as to the accuracy or completeness of the information provided, nor any loss arising from any investment based on a recommendation, forecast or other information supplied. You should always seek independent advice as to your suitability to speculate in any related markets and your ability to assume the associated risks, if you are at all unsure. We are not under any obligation to update any such material. Any opinion made may be personal to the author and may not reflect the opinion of StoneX Europe Ltd.