



Two trades to watch: FTSE, Oil
FTSE looks to re-test its all-time high. Oil holds strong gains ahead of EIA inventory data.
Share this:

FTSE looks to re-test its all-time high
The FTSE, along with its European peers, is set to open the day higher, following on from an upbeat close on Wall Street, after Federal Reserve Chair Powell sounded less hawkish than the markets had feared given Friday’s strong nonfarm payroll report.
Powell reiterated that disinflation was in process and that 2023 would be a year of significant declines in inflation. He added that If data continued to come in stronger than expected, then interest rates would certainly need to rise.
His comments helped to boost sentiment, lifting stocks and pulling the USD lower. This upbeat sentiment is translating to a stronger open in Europe.
The FTSE has managed to climb to record highs, thanks in part to its heavily weighted resource stocks as commodities prices have been boosted by China reopening. A 2.8% fall in the pound last week, also helped to support the many multinationals in the UK index, offering a favorable exchange rate for foreign earnings.
On the corporate calendar, Barratt Developments and Severn Trent are due to report.
Where next for the FTSE?
The FTSE is attempting to push beyond the 7913 the all-time high reached at the start of the week. The RSI supports further upside while it remains out of overbought territory.
Buyers could look for a rise above 7913 to bring 8000 the round number into focus.
On the flip side, immediate support can be seen at 7880, the January high. A break below here could bring 7770 the rising trendline support dating back to October into focus. A fall below 7706, the 2023 low is needed to create a lower low.


Oil holds strong gains ahead of EIA inventory data
Crude oil prices jumped 4% in the previous session and are holding onto those gains today. risk assets were boosted by a less hawkish than feared Federal Reserve chair Jerome Powell. Powell’s comments, or at least the FX and currency market’s perception of those comments, helped pull the USD lower, also supporting USD-denominated oil.
API inventory data was broadly shrugged off by the market. The API stockpile report showed that inventories unexpectedly rose by 2.1 million barrels in the week ending February 3. The API data also showed that gasoline and distillate stockpiles grew in the past week, suggesting that retail fuel consumption, which is a key driver of US demand, remains under pressure.
EIA data which is due later today is forecast to show an inventory build of 2.45 million barrels.
Where next for oil prices?
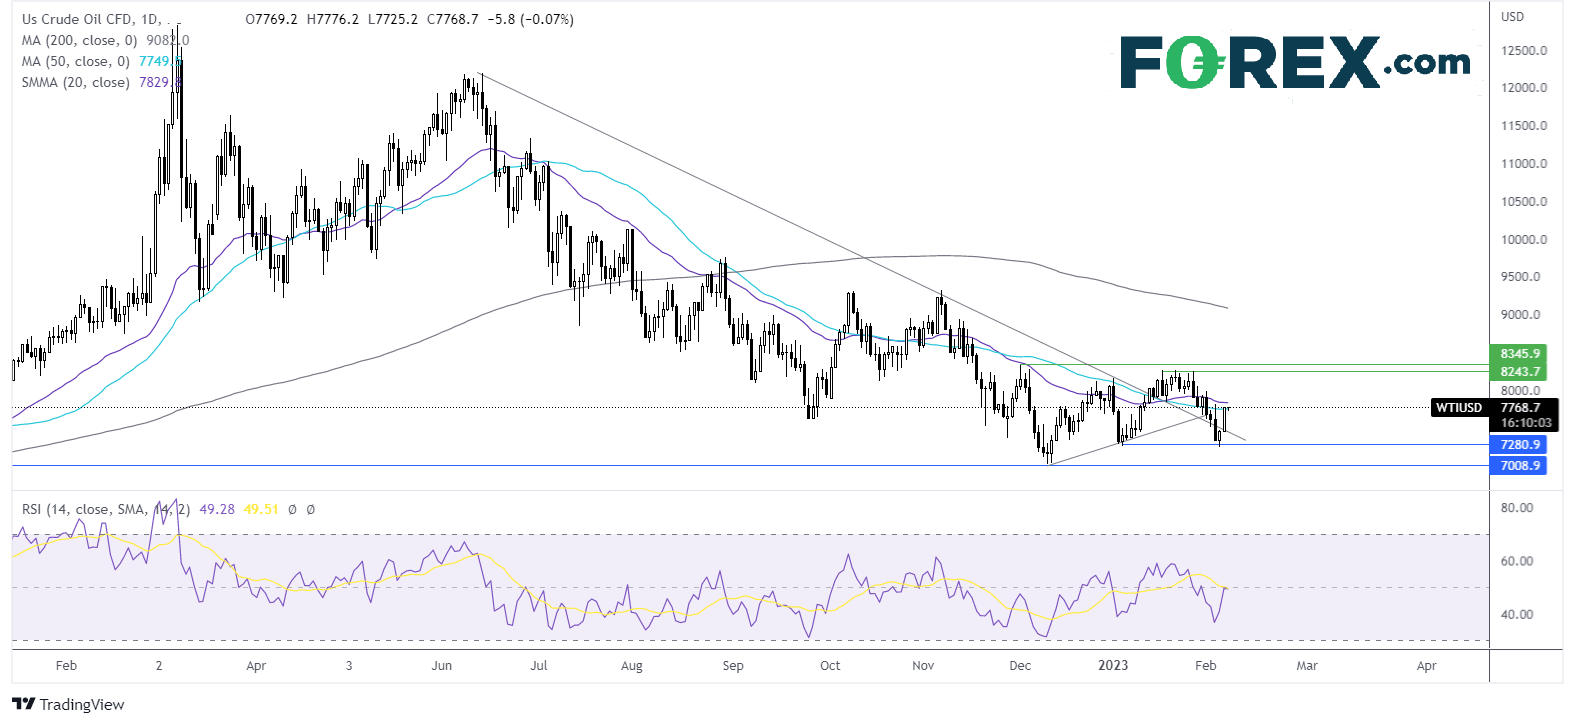
Having rebounded from 72.40 on Monday, oil prices have risen back above the multi-month falling trendline and have run into resistance at the 50 sma around 77.50. The RSI is neutral.
Buyers need to rise above 77.50 and 78.30 the 10 sma to bring 80.00 the psychological level back into play. A rise above here opens the door to resistance at 82.40-82.70. A rise above here creates a higher high.
On the flip side, should sellers successfully defend the 50 sma, the price could fall back towards 74.60 the falling trendline support and 72.40, for a lower low.

Related tags:


The complete CFD trading experience
Award-winning platforms, competitive spreads, low commissions and dedicated support.
We live and breathe the markets and are dedicated to helping traders realise their ambitions as we continue to set the industry bar.
Economic calendar
Web Trader platform
Our sophisticated web-based platform is packed with features.
Related articles

Oil Quietly Hands the Fed a Reason to Stay Hawkish
Oil prices and the U.S. dollar are both on the front foot as elevated energy costs feed Fed warnings that inflation may prove sticky.


S&P 500 forecast: Stocks extend drop as correction risks grow
US and global equity markets have extended Wednesday’s sell-off, with Wall Street opening lower after a weak handover from Asia and Europe. The deterioration in risk appetite has been spreading across global markets. The dollar was firmer, Treasury yields were holding onto yesterday’s gains, while gold, silver and bitcoin were all under pressure alongside equities and major currencies.

Gold forecast: XAU/USD could take a larger dive after the big rise in yields
Gold prices have been falling in the last few days after last week’s post-FOMC pop faded amid rising interest rate expectations, higher oil prices and a strengthening US dollar. As before, I wasn’t convinced gold would thrive in the current macro backdrop.
StoneX Europe Ltd may make third party material available on this website which may contain information included but not limited to the conditions of financial markets. The material is for information purposes only and does not contain, and should not be construed as containing, investment advice and/or investment recommendation and/or an investment research and/or an offer of or solicitation for any transactions in financial instruments; any decision to enter into a specific transaction shall be made by the client following an assessment by him/her of their situation.
StoneX Europe Ltd makes no representation or warranty and assumes no liability as to the accuracy or completeness of the information provided, nor any loss arising from any investment based on a recommendation, forecast or other information supplied. You should always seek independent advice as to your suitability to speculate in any related markets and your ability to assume the associated risks, if you are at all unsure. We are not under any obligation to update any such material. Any opinion made may be personal to the author and may not reflect the opinion of StoneX Europe Ltd.