



Two trades to watch Gold SP500
Fed Powell expressed little or no concern over the rise in bond yields giving the green light for a further spike in yields. Gold looks vulnerable under $1700, S&P 500 falls through key support.
Share this:

Gold looks vulnerable below $1700
Jerome Powell expressed little to no concern over the recent spike in bond yields.
The US Dollar surged following the Fed Chair’s appearance, dragging on gold.
With bond yields rising on high inflation expectations, non-yielding gold looks less attractive.
Attention will turn to US NFP to see whether they support rising inflation expectations.
What are non -farm payrolls?
Where next for gold?
Gold fell 0.8% in the previous session and is on track for 2% decline this week.
Gold hit an overnight multi-month low of $1687 as the price tested the lower band of a falling wedge on the 4 hour chart and horizontal support from June. The support has remained firm so far.
The RSI is hovering around oversold territory so some consolidation or a small bounce could be on the cards before further downside.
A close below the level could confirm a downside breakout with a deep decline towards 1670 June low on the cards.
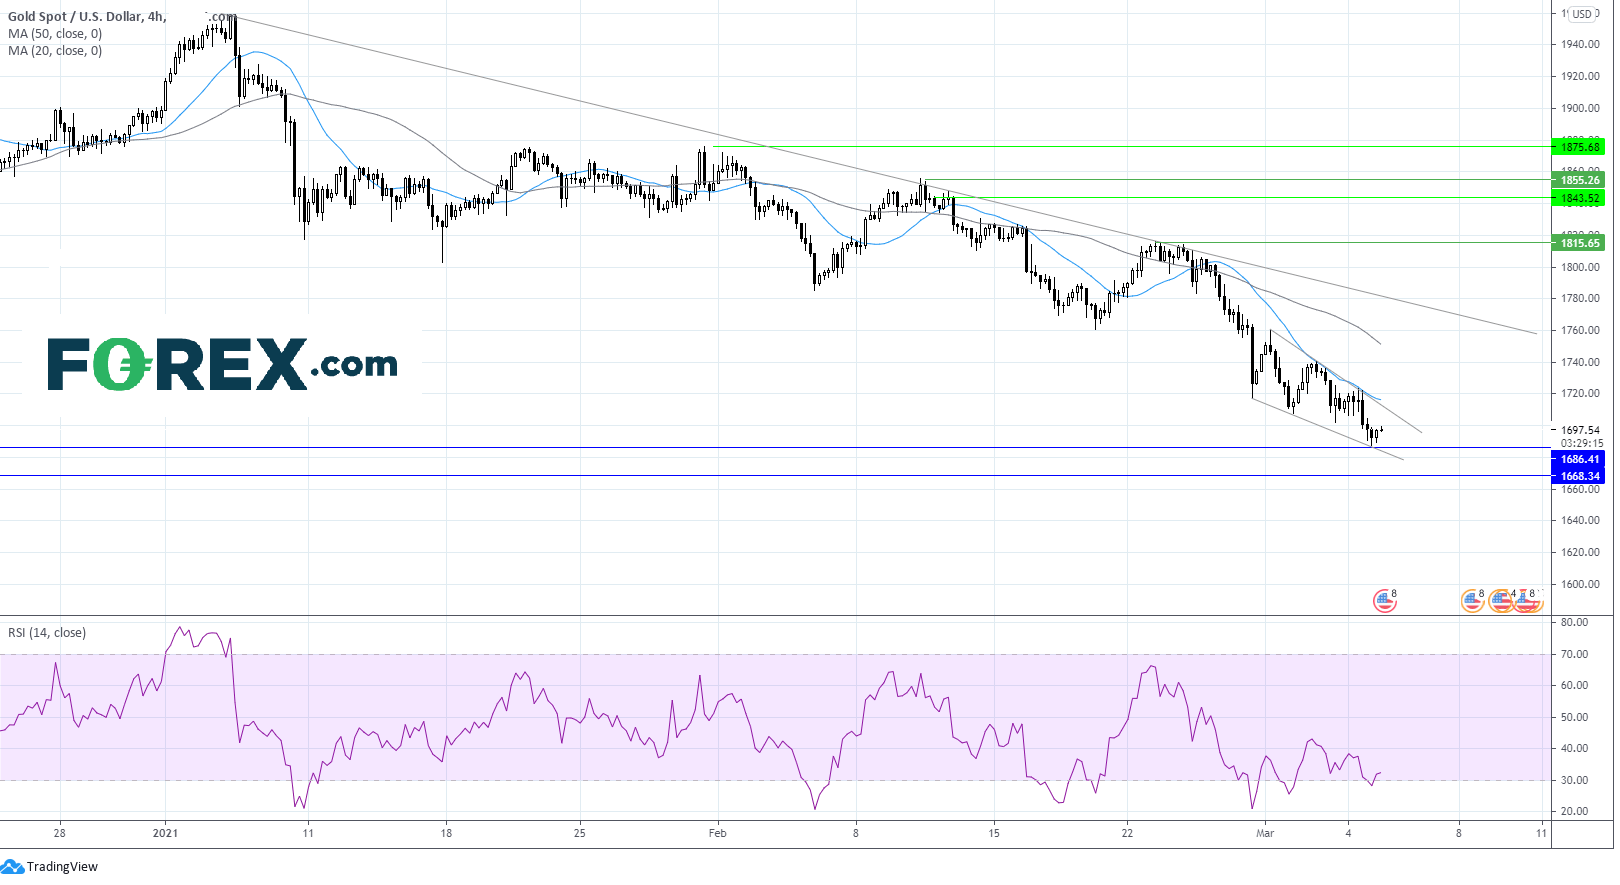
On the upside any recovery could find resistance at $1700 round number. A break through this level could sees the price look to attack $1717 the confluence of the upper band of the falling wedge and the 20 sma.
Learn more about trading commodities
S&P 500 break below key support post Powell, NFP in focus
The S&P 500 sank 1.3% on Thursday after Fed Powell failed to calm bond market volatility fears, sending bond yields surging to 1.50%
Treasury yields hit 1.50% a one year high.
The spike in yields is negative for stocks as it points to higher borrowing costs which slows growth.
A strong NFP could prompt higher inflation expectations and drag the S&P 500 lower.
Where next for the S&P500?
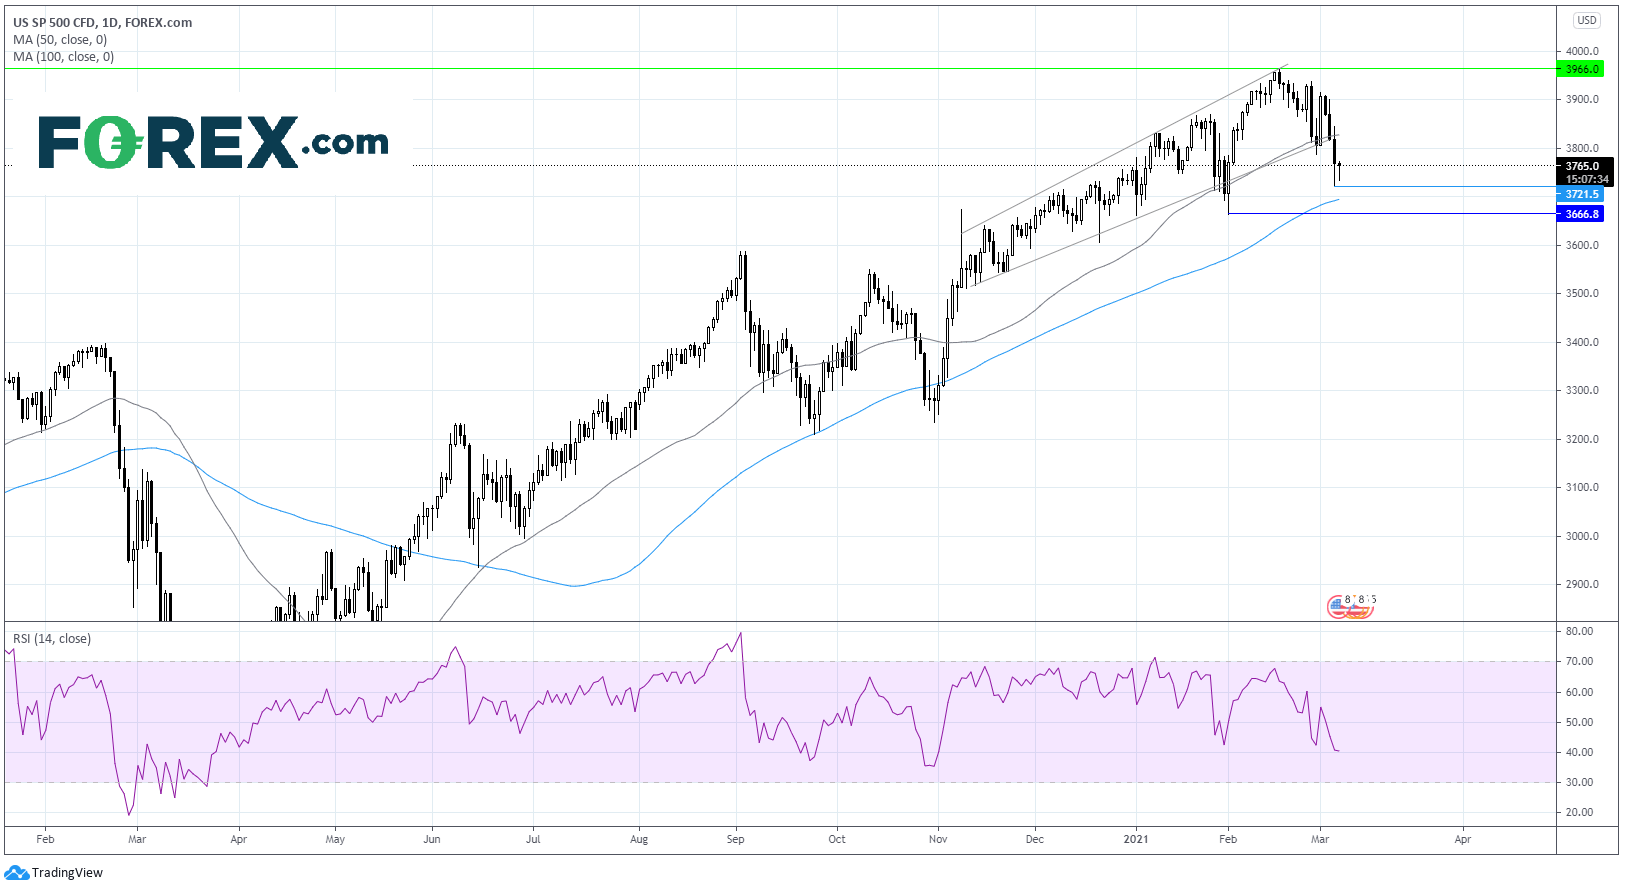
The S&P slumped on Thursday falling through the key level of 3820, the confluence of the 50 sma on the daily chart and the lower band of the ascending trend line dating back to early November.
The S&P found support at 3720 (low 27 Jan) and has since rebounded to 3764.
However, the outlook remains bearish with the RSI supportive of further losses.
Immediate support can be seen at 3720 yesterday’s low. A break bellow here could see the 100 sma and round number tested at 3700 ahead of the yearly low of 3640.
Any recovery will need to break above 3820 which looks to be a strong nut to crack.
Learn more about trading indices
Gold looks vulnerable below $1700
Jerome Powell expressed little to no concern over the recent spike in bond yields.
The US Dollar surged following the Fed Chair’s appearance, dragging on gold.
With bond yields rising on high inflation expectations, non-yielding gold looks less attractive.
Attention will turn to US NFP to see whether they support rising inflation expectations.
What are non -farm payrolls?
Where next for gold?
Gold fell 0.8% in the previous session and is on track for 2% decline this week.
Gold hit an overnight multi-month low of $1687 as the price tested the lower band of a falling wedge on the 4 hour chart and horizontal support from June. The support has remained firm so far.
The RSI is hovering around oversold territory so some consolidation or a small bounce could be on the cards before further downside.
A close below the level could confirm a downside breakout with a deep decline towards 1670 June low on the cards.
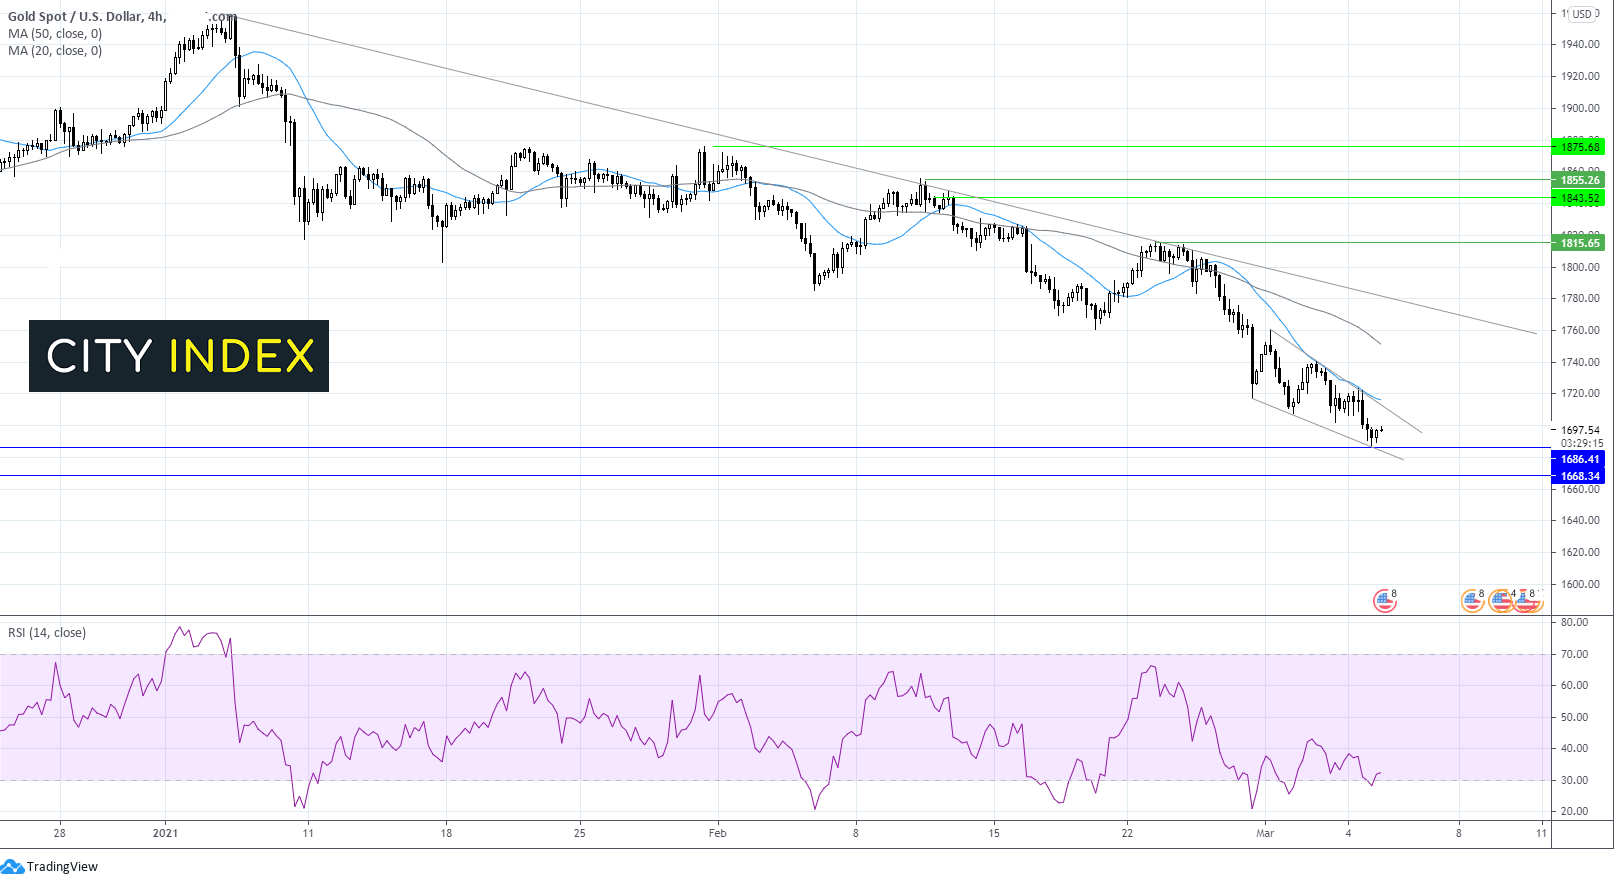
On the upside any recovery could find resistance at $1700 round number. A break through this level could sees the price look to attack $1717 the confluence of the upper band of the falling wedge and the 20 sma.
Learn more about trading commodities
S&P 500 break below key support post Powell, NFP in focus
The S&P 500 sank 1.3% on Thursday after Fed Powell failed to calm bond market volatility fears, sending bond yields surging to 1.50%
Treasury yields hit 1.50% a one year high.
The spike in yields is negative for stocks as it points to higher borrowing costs which slows growth.
A strong NFP could prompt higher inflation expectations and drag the S&P 500 lower.
Where next for the S&P500?
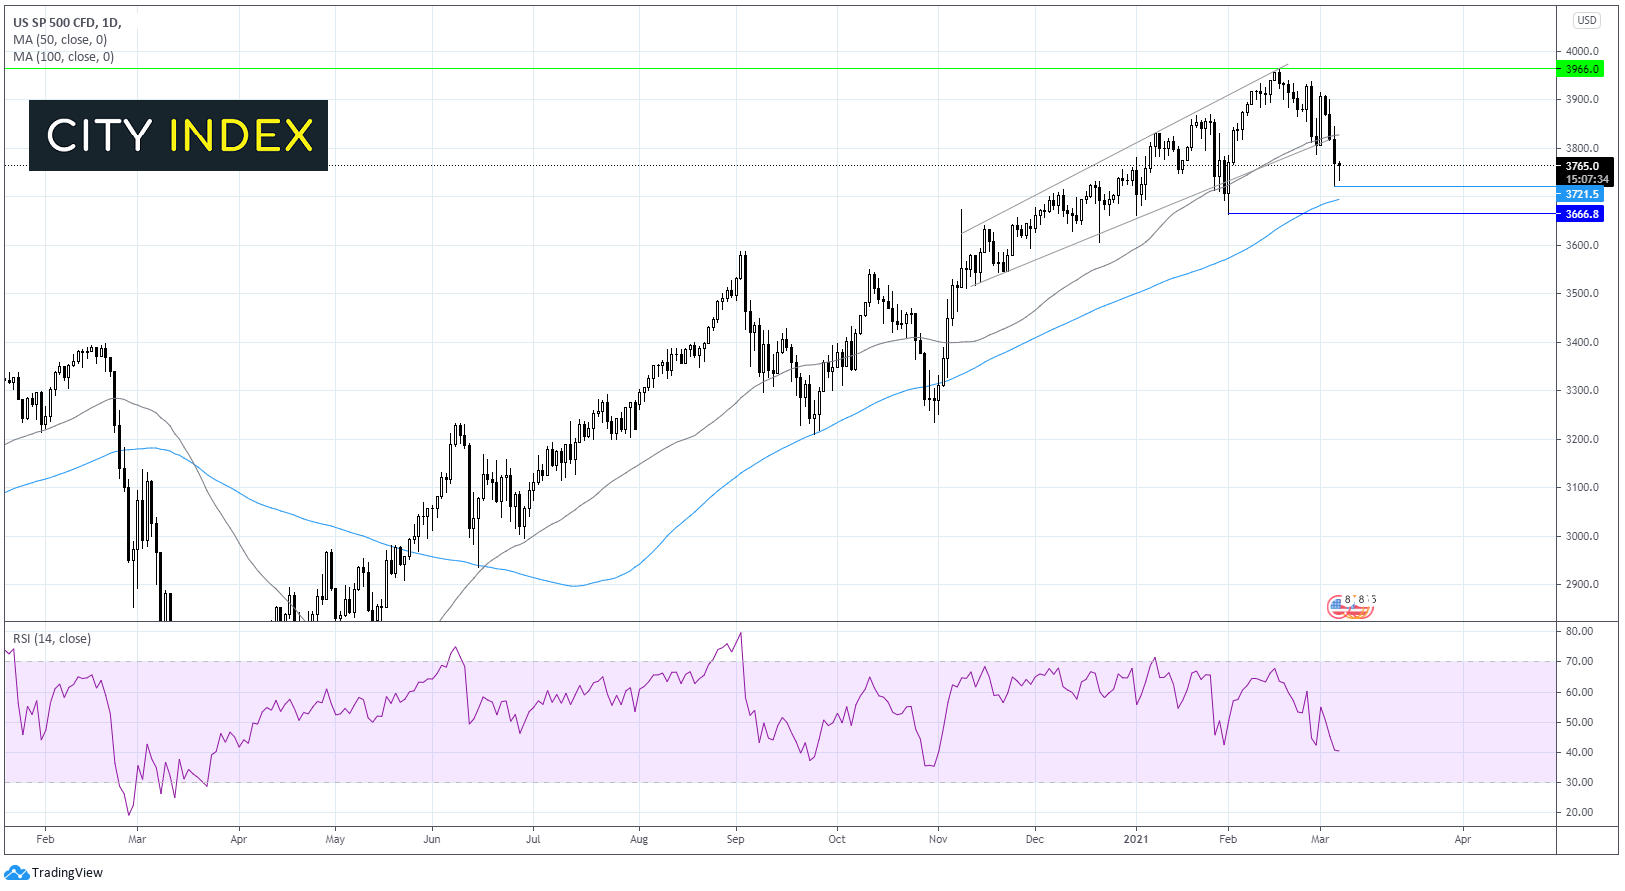
The S&P slumped on Thursday falling through the key level of 3820, the confluence of the 50 sma on the daily chart and the lower band of the ascending trend line dating back to early November.
The S&P found support at 3720 (low 27 Jan) and has since rebounded to 3764.
However, the outlook remains bearish with the RSI supportive of further losses.
Immediate support can be seen at 3720 yesterday’s low. A break bellow here could see the 100 sma and round number tested at 3700 ahead of the yearly low of 3640.
Any recovery will need to break above 3820 which looks to be a strong nut to crack.
Learn more about trading indices
Latest market news




The complete CFD trading experience
Award-winning platforms, competitive spreads, low commissions and dedicated support.
We live and breathe the markets and are dedicated to helping traders realise their ambitions as we continue to set the industry bar.
Economic calendar
Web Trader platform
Our sophisticated web-based platform is packed with features.
Related articles
S&P 500, Nasdaq, Dow Forecast: Wall Street Split Widens Into Month-End 9 26 2026
Nasdaq strength contrasts with mounting Dow pressure as rising Treasury yields raise the stakes for stocks heading into the monthly close.

Gold Price Forecast: XAU/USD Avoids Breakdown as Yields Surged but Can it Continue?
Surging Treasury yields sent a jolt across markets last week but, so far, gold prices have held above the FOMC low. The big question now is whether that can continue and, if not, will bulls show up at $4100 or $4k like they did in June and July?

Gold Q4 2026 outlook: Resilience in the face of rallying dollar and yields
As we headed towards the latter stages of Q3 and into Q4, the Fed had just hiked rates in a hawkish FOMC meeting, while the likes of the ECB and BoJ had also tightened their respective policies. Oil prices remained elevated amid the prolonged US-Iran conflict. Meanwhile, bond yields were breaking out, and the dollar was higher across the board. Yet, remarkably, gold was still holding in the positive territory for the third quarter, even if it had weakened somewhat in September.

StoneX Europe Ltd may make third party material available on this website which may contain information included but not limited to the conditions of financial markets. The material is for information purposes only and does not contain, and should not be construed as containing, investment advice and/or investment recommendation and/or an investment research and/or an offer of or solicitation for any transactions in financial instruments; any decision to enter into a specific transaction shall be made by the client following an assessment by him/her of their situation.
StoneX Europe Ltd makes no representation or warranty and assumes no liability as to the accuracy or completeness of the information provided, nor any loss arising from any investment based on a recommendation, forecast or other information supplied. You should always seek independent advice as to your suitability to speculate in any related markets and your ability to assume the associated risks, if you are at all unsure. We are not under any obligation to update any such material. Any opinion made may be personal to the author and may not reflect the opinion of StoneX Europe Ltd.