




Two trades to watch SP500 GBPUSD
Rising yields drag on S&P 500 boost USD, GBP/USD eyes 1.39
Share this:

Rising yields drag on S&P500
After closing 2.4% lower on Thursday the S&P 500 is on the decline once again and now trades 3% below its all time high of 3950.
Investors are increasingly betting that the US economy will overheat on the back of a strong vaccine led recovery and with the Biden administration’s $1.9 trillion stimulus package causing the Fed to intervene.
US treasury yields rose to 1.6% the highest level since February 2020, taking the shine off stocks and boosting the USD. Today’s yields have eased back slightly to 1.5%.
US personal spending & income data due in the US session.
Where next for the S&P 500?
The S&P 500 reached an all time high of 3950 mid February and has bee trending lower ever since.
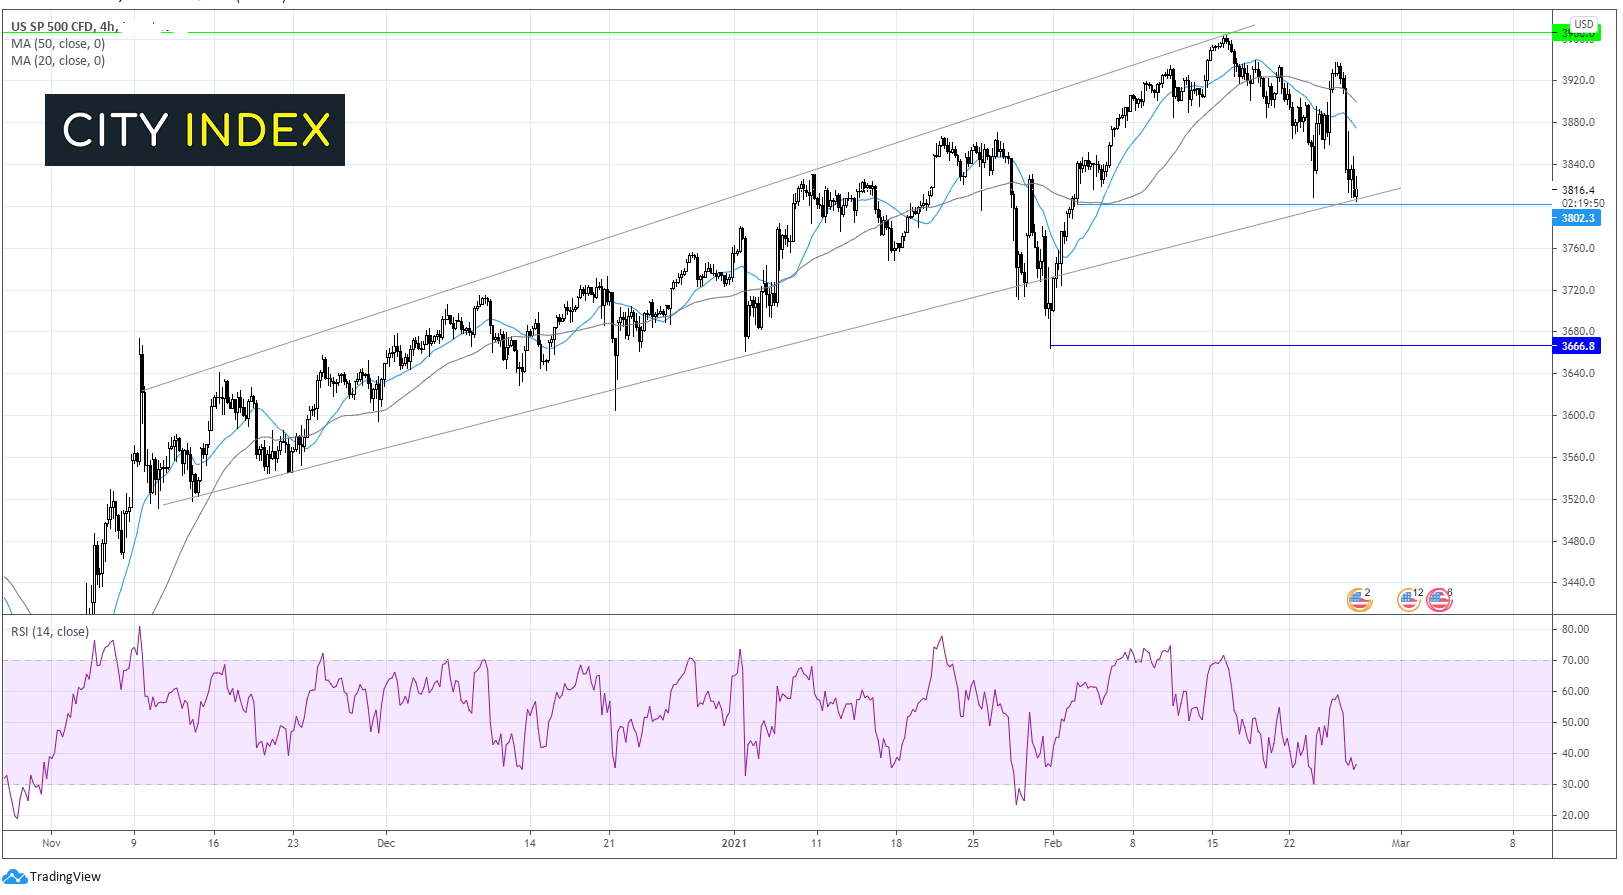
It trades below its 20& 50 sma on the 4 hrs chart. The 20 sma crossed below the 50 sma in a bearish signal and the RSI is supportive of further losses.

GBP/USD heads for 1.39
The S&P 500 has bounced off support of the lower channel of the ascending channel and horizontal support at 3805, today’s low. A move below this level is needed for the bears to target a much deeper selloff towards 3665 the yearly low.
GBP/USD heads for 1.39
GBP was one of the top performing G10 currencies across the start of the week meaning it had the furthest to fall as the USD storms the board.
USD strengthens as the bond market rout deepens
BoE Governor Andrew Bailey expects an economic contraction in Q1
Where next for GBP/USD?
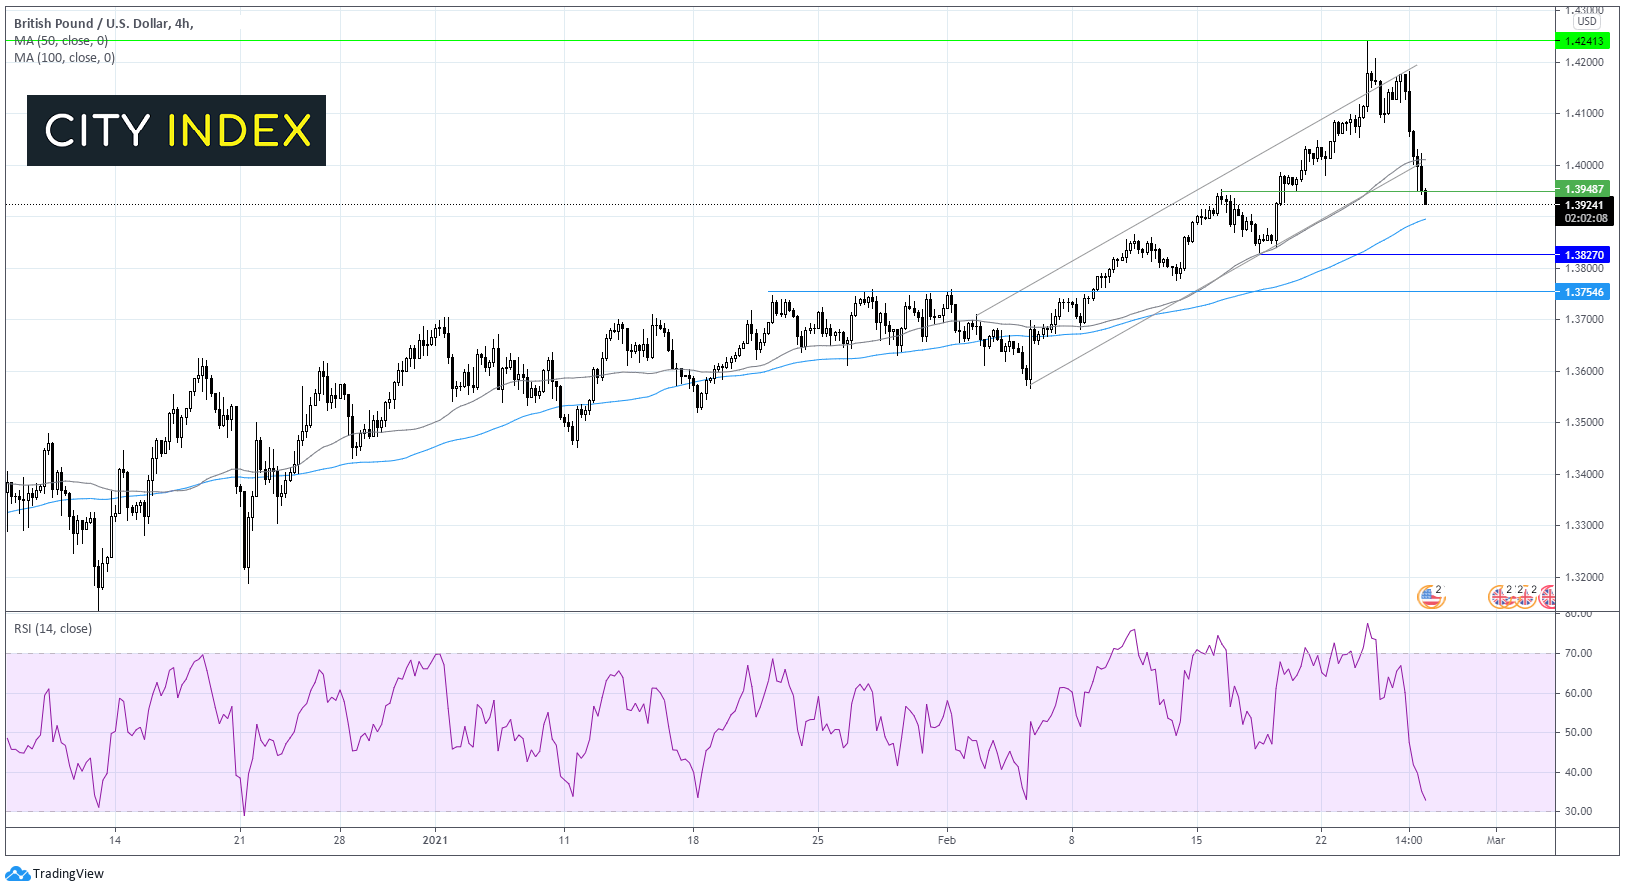
The overnight selloff saw GBP/USD fall below the lower band of three week ascending trendline which could be the first sign that the pair has topped.
The RSI is in bearish territory but not yet oversold, indicative of further weakness.
Immediate support can be seen at 100 sma at 1.3900 before the bears target 1.3830 low 17th Feb before 1.3750 resistance turned support from late January.
Any attempt at a rebound would need to break back above support turned resistance at 1.3950 ahead of the key 1.40 level which if the 50 sma, the low band of the ascending trendline and a key psychological level. A move above here could see the bullish move gain momentum once again.
Rising yields drag on S&P500
After closing 2.4% lower on Thursday the S&P 500 is on the decline once again and now trades 3% below its all time high of 3950.
Investors are increasingly betting that the US economy will overheat on the back of a strong vaccine led recovery and with the Biden administration’s $1.9 trillion stimulus package causing the Fed to intervene.
US treasury yields rose to 1.6% the highest level since February 2020, taking the shine off stocks and boosting the USD. Today’s yields have eased back slightly to 1.5%.
US personal spending & income data due in the US session.
Where next for the S&P 500?
The S&P 500 reached an all time high of 3950 mid February and has bee trending lower ever since.
It trades below its 20& 50 sma on the 4 hrs chart. The 20 sma crossed below the 50 sma in a bearish signal and the RSI is supportive of further losses.
GBP/USD heads for 1.39
The S&P 500 has bounced off support of the lower channel of the ascending channel and horizontal support at 3805, today’s low. A move below this level is needed for the bears to target a much deeper selloff towards 3665 the yearly low.
GBP/USD heads for 1.39
GBP was one of the top performing G10 currencies across the start of the week meaning it had the furthest to fall as the USD storms the board.
USD strengthens as the bond market rout deepens
BoE Governor Andrew Bailey expects an economic contraction in Q1
Where next for GBP/USD?
The overnight selloff saw GBP/USD fall below the lower band of three week ascending trendline which could be the first sign that the pair has topped.
The RSI is in bearish territory but not yet oversold, indicative of further weakness.
Immediate support can be seen at 100 sma at 1.3900 before the bears target 1.3830 low 17th Feb before 1.3750 resistance turned support from late January.
Any attempt at a rebound would need to break back above support turned resistance at 1.3950 ahead of the key 1.40 level which if the 50 sma, the low band of the ascending trendline and a key psychological level. A move above here could see the bullish move gain momentum once again.



The complete CFD trading experience
Award-winning platforms, competitive spreads, low commissions and dedicated support.
We live and breathe the markets and are dedicated to helping traders realise their ambitions as we continue to set the industry bar.
Economic calendar
Web Trader platform
Our sophisticated web-based platform is packed with features.
Related articles

USD/JPY outlook: Hawkish Fed recalibration pressures the yen
Stronger US growth momentum and rising Treasury yields are keeping USD/JPY pointed higher, even as Japanese policymakers try to limit the pressure building across domestic markets.


USD/MXN Forecast: Peso Loses Momentum Ahead of Banxico Decision
Over recent trading sessions, the Mexican peso has started to show signs of losing strength against the U.S. dollar. This can be seen in the performance of USD/MXN, which has gained more than 1.7% over the last three sessions, highlighting the dollar's renewed strength against the peso.


Euro Short-term Outlook: EUR/USD Selloff Nears Critical Yearly Support 9 23 2026
Euro has fallen seven of the past nine sessions, with stretched momentum raising the stakes as EUR/USD closes in on a major inflection zone.

StoneX Europe Ltd may make third party material available on this website which may contain information included but not limited to the conditions of financial markets. The material is for information purposes only and does not contain, and should not be construed as containing, investment advice and/or investment recommendation and/or an investment research and/or an offer of or solicitation for any transactions in financial instruments; any decision to enter into a specific transaction shall be made by the client following an assessment by him/her of their situation.
StoneX Europe Ltd makes no representation or warranty and assumes no liability as to the accuracy or completeness of the information provided, nor any loss arising from any investment based on a recommendation, forecast or other information supplied. You should always seek independent advice as to your suitability to speculate in any related markets and your ability to assume the associated risks, if you are at all unsure. We are not under any obligation to update any such material. Any opinion made may be personal to the author and may not reflect the opinion of StoneX Europe Ltd.