




Two trades to watch USDCAD WTI oil
USD/CAD looks to the BoC rate decision later today. WTI oil awaits API inventory data for further impetus.
Share this:

USD/CAD ahead of BoC rate decision
The BoC reined in its bond purchases by C$1 billion in July, bringing the total to C$2 billion per month.
Since then the situation in Canada has deteriorated amid rising covid cases which have slowed the economic recovery. Political stability is also under the spotlight ahead of the elections on September 20th.
As a result, the BoC are not expected to adjust monetary policy. A further tapering of bond purchases looks unlikely this month. However, the central bank is expected to retain its first-rate hike for H2 2022.
Where next for USD/CAD?
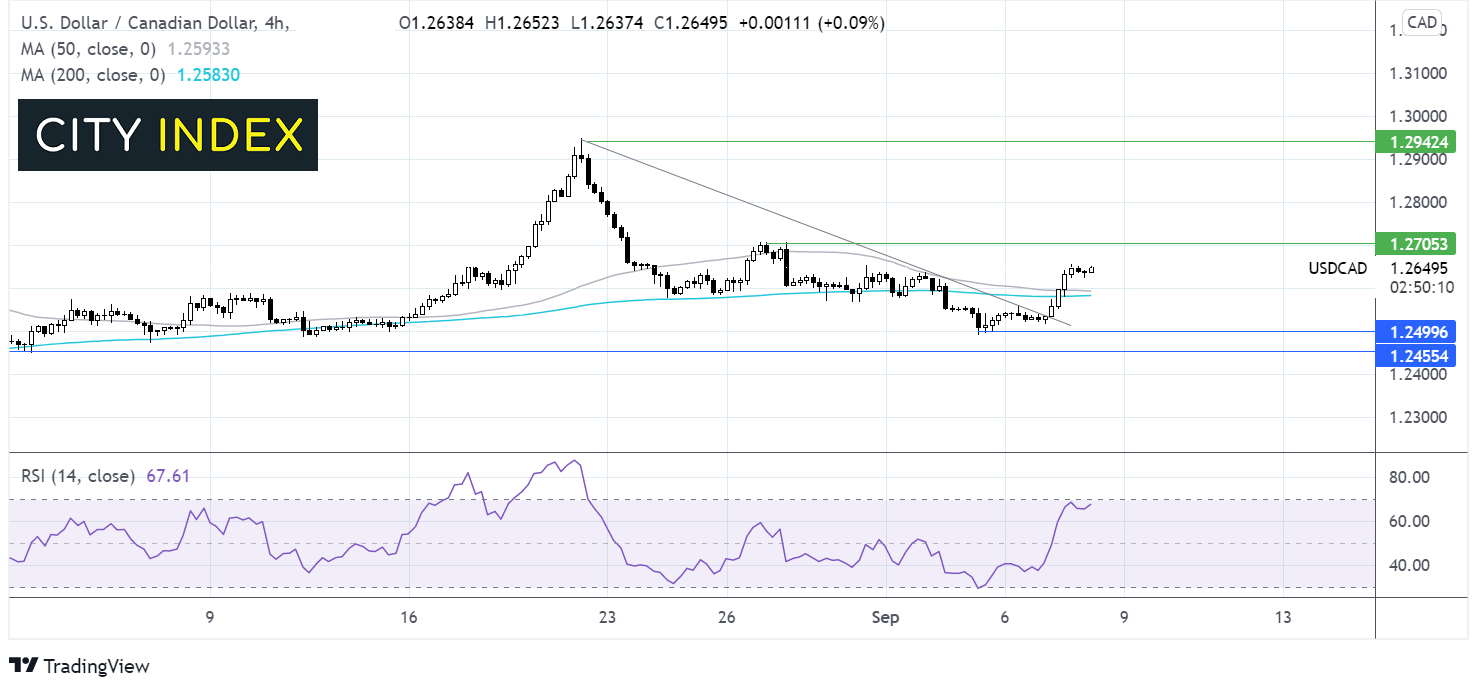
USD/CAD has gained just shy of 1% so far this week. The push higher has seen the pair break above the descending trendline dating back to August 20, the 50 & 200 sma. The rise higher has run into resistance around 1.2650. The RSI is supportive of further gains whilst it remains out of overbought territory.
A meaningful move above 1.2650 is needed for the pair to reclaim 1.27 the late August high and look back towards 1.2940 the August high.
Strong support can be seen around 1.2580 the confluence of the 50 & 200 sma ahead of 1.25 the September low and 1.2450 the August low.
US crude oil prices look to inventory data
Oil prices are edging higher paring losses from the previous session as investors continue weighing up demand concerns, the slow pick up of production in the US Gulf of Mexico and a rising US Dollar.
Producers in the US Gulf of Mexico are struggling to kick start production 9 days after Hurricane Ida. 79% of Gulf production remains offline.
API inventory data today and EIA data tomorrow will be closely watched today for further insight as to how the storm impacted production and refinery output. Expectations are for a draw in inventories of 3.8 million barrels and gasoline stocks a draw of 3.6 million barrels.
Where next for WTI?
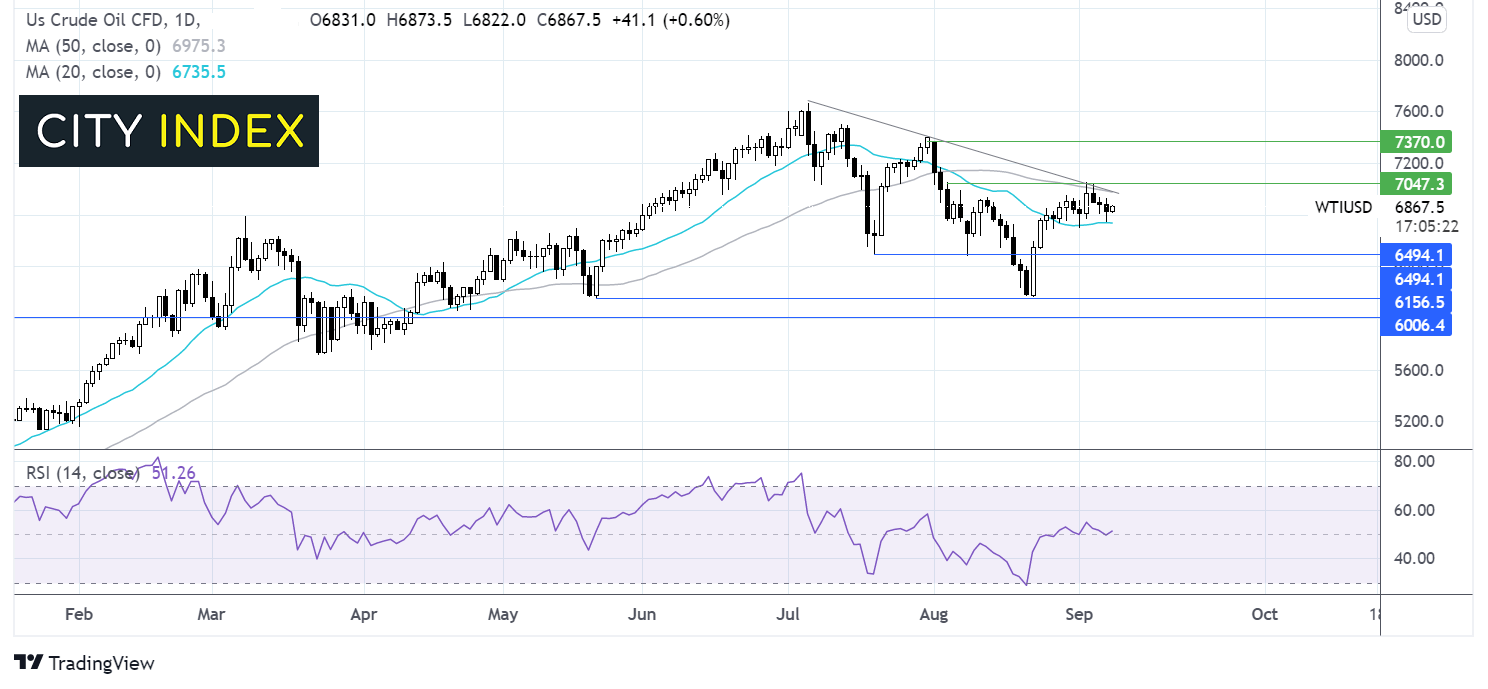
WTI crude oil rebounded off the 20 sma but faced tough resistance from the two-month descending trendline and the 50 sma on the daily chart.
The RSI is offering few clues at 50 and the price remains between the 20 & 50 sma.
Traders might look for a breakout trade here with sellers watching for a move below the 20 sma at 67.45 which could open the door towards 65.10 the July low.
Buyers might wait for a move above 69.75 the 50 sma and descending trendline resistance for a move towards 73.70 the August high.
USD/CAD ahead of BoC rate decision
The BoC reined in its bond purchases by C$1 billion in July, bringing the total to C$2 billion per month.
Since then the situation in Canada has deteriorated amid rising covid cases which have slowed the economic recovery. Political stability is also under the spotlight ahead of the elections on September 20th.
As a result, the BoC are not expected to adjust monetary policy. A further tapering of bond purchases looks unlikely this month. However, the central bank is expected to retain its first-rate hike for H2 2022.
Read in more detail about BoC expectations
Where next for USD/CAD?
USD/CAD has gained just shy of 1% so far this week. The push higher has seen the pair break above the descending trendline dating back to August 20, the 50 & 200 sma. The rise higher has run into resistance around 1.2650. The RSI is supportive of further gains whilst it remains out of overbought territory.
A meaningful move above 1.2650 is needed for the pair to reclaim 1.27 the late August high and look back towards 1.2940 the August high.
Strong support can be seen around 1.2580 the confluence of the 50 & 200 sma ahead of 1.25 the September low and 1.2450 the August low.
US crude oil prices look to inventory data
Oil prices are edging higher paring losses from the previous session as investors continue weighing up demand concerns, the slow pick up of production in the US Gulf of Mexico and a rising US Dollar.
Producers in the US Gulf of Mexico are struggling to kick start production 9 days after Hurricane Ida. 79% of Gulf production remains offline.
API inventory data today and EIA data tomorrow will be closely watched today for further insight as to how the storm impacted production and refinery output. Expectations are for a draw in inventories of 3.8 million barrels and gasoline stocks a draw of 3.6 million barrels.
Where next for WTI?
WTI crude oil rebounded off the 20 sma but faced tough resistance from the two-month descending trendline and the 50 sma on the daily chart.
The RSI is offering few clues at 50 and the price remains between the 20 & 50 sma.
Traders might look for a breakout trade here with sellers watching for a move below the 20 sma at 67.45 which could open the door towards 65.10 the July low.
Buyers might wait for a move above 69.75 the 50 sma and descending trendline resistance for a move towards 73.70 the August high.
How to trade with City Index
Follow these easy steps to start trading with City Index today:
- Open a City Index account, or log-in if you’re already a customer.
- Search for the market you want to trade in our award-winning platform.
- Choose your position and size, and your stop and limit levels
- Place the trade.
Latest market news




The complete CFD trading experience
Award-winning platforms, competitive spreads, low commissions and dedicated support.
We live and breathe the markets and are dedicated to helping traders realise their ambitions as we continue to set the industry bar.
Economic calendar
Web Trader platform
Our sophisticated web-based platform is packed with features.
Related articles
EUR/USD, USD/JPY Outlook: Oil, yields and an FX identity crisis
Crude oil is setting the tone across rates and FX, leaving EUR/USD vulnerable and USD/JPY caught between higher Treasury yields and the growing threat of intervention

Nasdaq 100 Forecast: NDX falls as oil jumps and Treasury yields rise
U.S. stocks are pointing to a weaker open on Monday after President Trump rejected an Iranian ceasefire, sending oil prices higher and fuelling inflationary concerns and pushing Treasury yields higher.

Crude Oil Q4 2026 Outlook: Will a New Energy-Security Regime Emerge?
Crude Oil Q4 2026 Outlook: The U.S.-Iran conflict has done more than disrupt oil flows. It has challenged many of the assumptions underpinning the global energy security system established after the 1973 oil embargo.

StoneX Europe Ltd may make third party material available on this website which may contain information included but not limited to the conditions of financial markets. The material is for information purposes only and does not contain, and should not be construed as containing, investment advice and/or investment recommendation and/or an investment research and/or an offer of or solicitation for any transactions in financial instruments; any decision to enter into a specific transaction shall be made by the client following an assessment by him/her of their situation.
StoneX Europe Ltd makes no representation or warranty and assumes no liability as to the accuracy or completeness of the information provided, nor any loss arising from any investment based on a recommendation, forecast or other information supplied. You should always seek independent advice as to your suitability to speculate in any related markets and your ability to assume the associated risks, if you are at all unsure. We are not under any obligation to update any such material. Any opinion made may be personal to the author and may not reflect the opinion of StoneX Europe Ltd.