







US Banks Q2 Earnings Preview
US Q2 earnings could be some of the most eagerly awaited reports in recent memory. Whilst Q1 earnings only included a few short weeks of the coronavirus crisis, Q2 bore the brunt of the crisis
Share this:

US Q2 earnings could be some of the most eagerly awaited reports in recent memory. Whilst Q1 earnings were a big deal, they only included a few short weeks of the coronavirus crisis, furthermore January and February were solid months.
The second quarter bore the brunt of the crisis, including lockdown. As a result, bank earnings are expected to be down around 70% compared to the previous year.
Revenue
Revenue is expected to take a bigger hit in Q2 compared to Q1. The Fed dropped interest rates to 0% in March meaning net interest income will be squeezed. M&A and IPO activity also dried up in the quarter amid lockdown restrictions.
On a positive note, mortgage activity could be a positive as refinancing surged as 10 year treasuries dropped to historic lows. Purchase mortgage activity is also showing signs of picking up as states reopen and this could be reflected in Q2 results.
Another plus point is expected to be impressive trading revenue amid high volatility owing to the coronavirus crises. However, there is a good chance that rising trading revenues will be offset by high bad loan provisions.
Bad loans
As companies’ default on borrowing or defer payments bad loans are expected to increase. Provisions for bad loans were eye watering n the first quarter, for some banks the amount that they need to set aside for bad loans has increased further in the second quarter. These bad loan provisions cut directly into profits. With no V-shaped recovery in sight and a long rocky road to recovery bad loans could continue to drag on bank’s profits for some time to come.
Guidance
Most banks withdrew their guidance for the year given the extreme levels of uncertainty. Since then, there has been a lot more data released, and banks will also have more data on their customers as well. The big question is whether banks will provide guidance for the remainder of the year? The outlook is still very uncertain. However, the banks could well have seen an improvement in the last few weeks of the quarter as lock down measure ease and this could give them confidence to provide some type of outlook across the coming quarters.
Chart thoughts
JP Morgan - Reports 14th July
The stock trades -20% YTD, under performing the broader market. Whilst the ascending trendline is just about holding, JP Morgan trades below its 50, 100 & 200 daily moving averages. $90 has proved to be an important level for the stock over the past 6 months. Should $90 hold as support the share price could look to attack $96.00 (50 sma). A break below $90.00 could open the door to support at $88.00.
Wells Fargo - Reports 14th July
Wells Fargo is the only bank which has failed to pick up from March lows, instead the stock tanked further towards a May nadir. The stock trades below its 50, 100 &200 daily moving average and below its descending trendline, targeting the May low of $22.00. A break above 50 sma at $27 could see more upside to come.
Citigroup - Reports 14th July
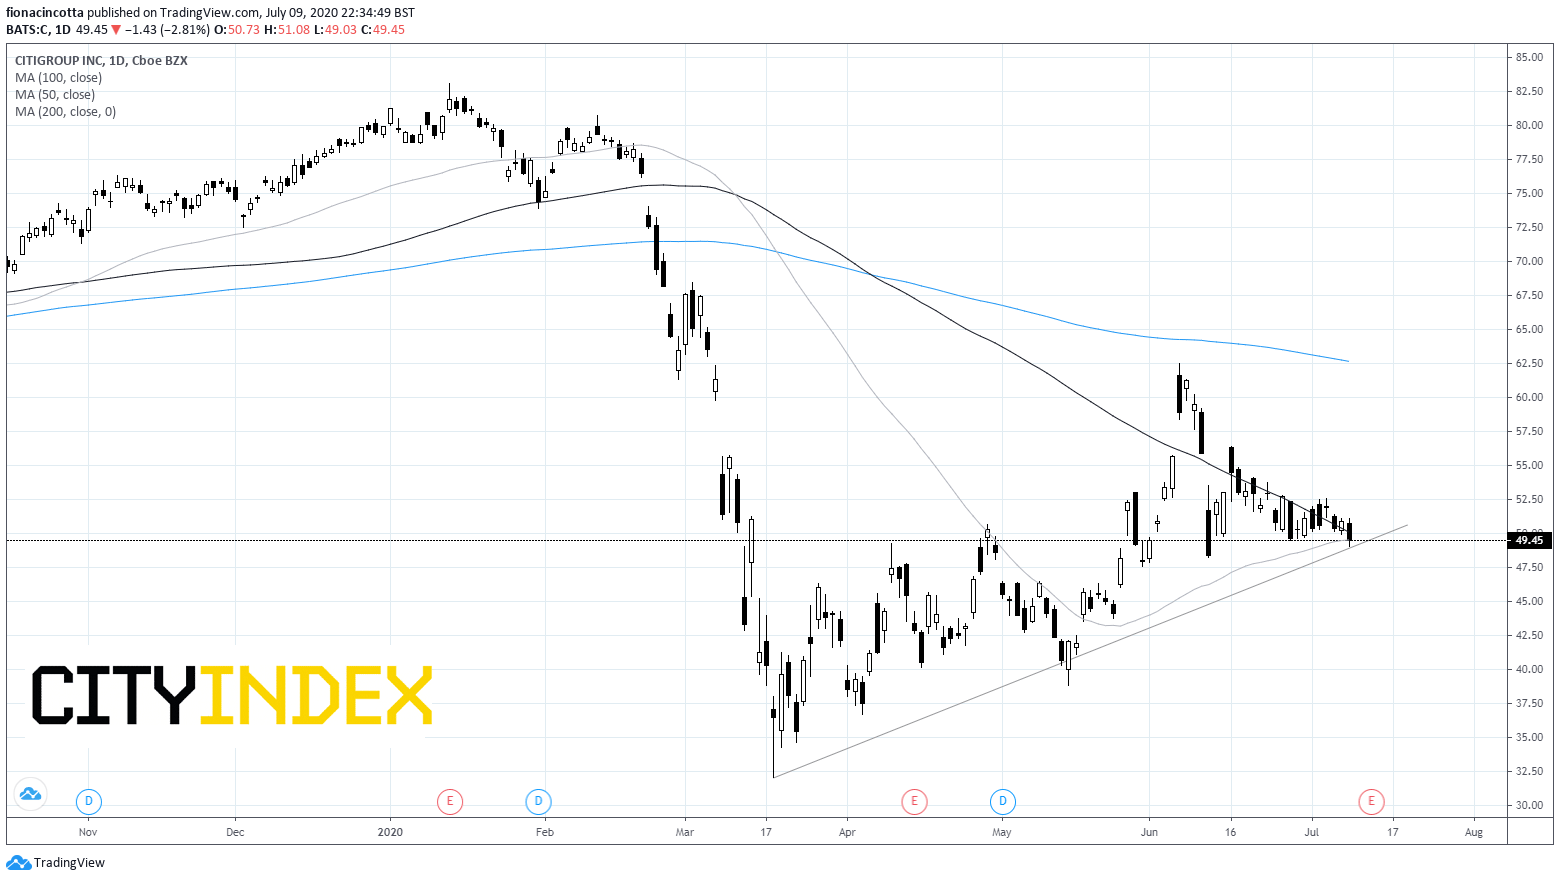
Up an impressive 66% from March lows, Citi has so far outperformed its peers in the recovery. However, the stock is still down 30% YTD, significantly more than Goldman Sachs which is now just down -4% YTD.
Citigroup sits at a crucial point $49.5/ $50.00 on the chart, testing its 50 and 100 sma and its ascending trendline.
Goldman Sachs - Reports 15th July
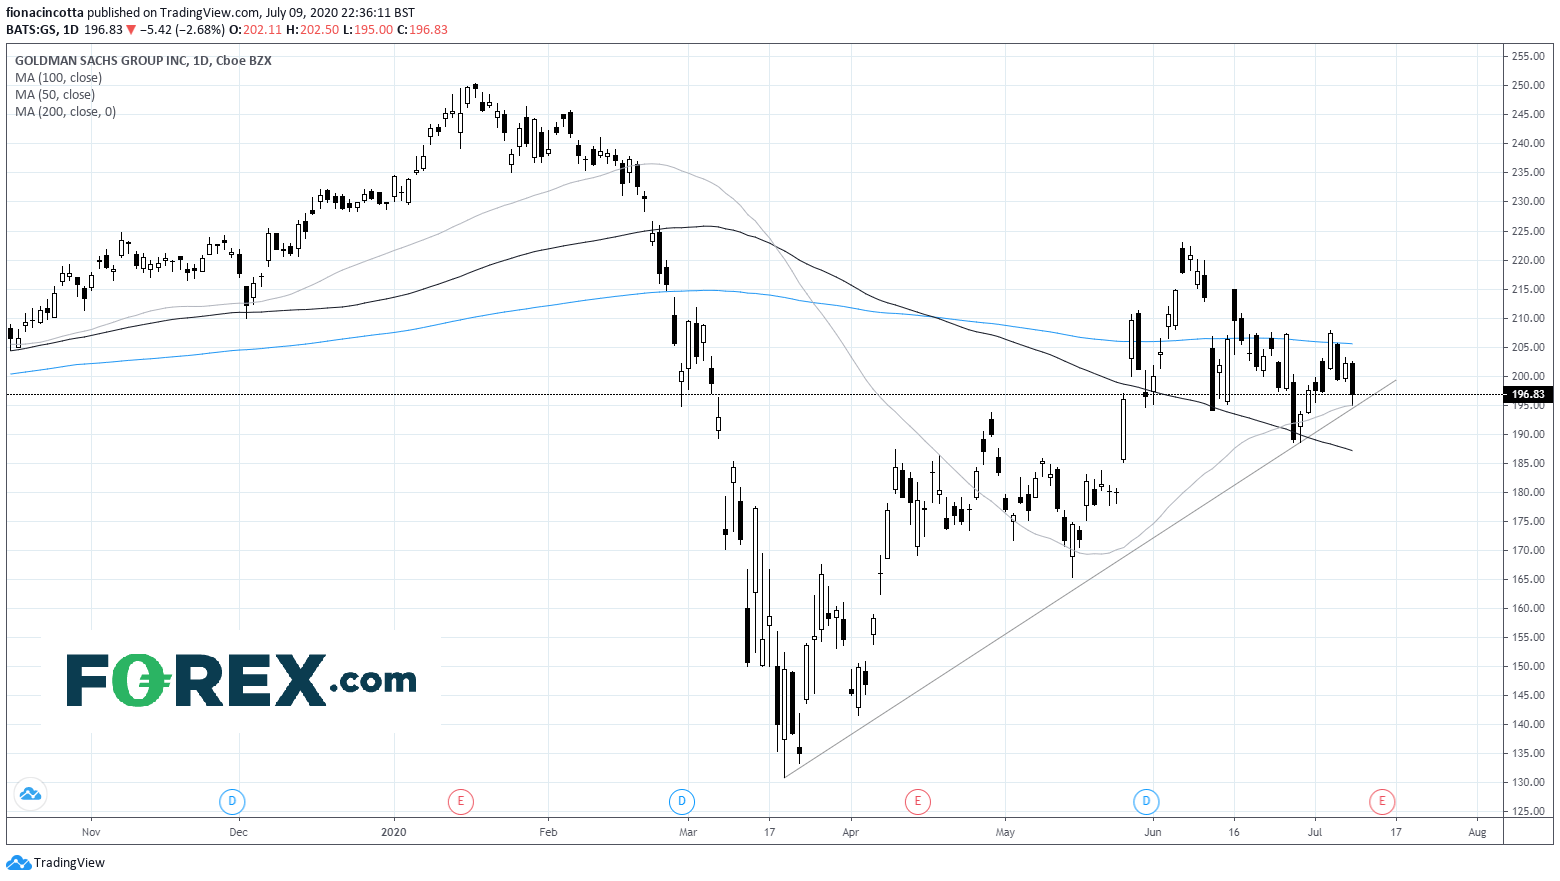
Goldman Sachs has seen an impressive run from March lows in the region of 50% from Thursday’s close. The price trades above its 100 daily moving average and the 50 ma is holding, offering support at $294, Thursday’s low. The ascending trendline also holds around that same 194.00 level. A breath through here could negate the current uptrend and open the door to the 100 ma at $187.00.
Should the trend line and 50 ma hold, Goldman’s could look to attach the 200 ma at $205.00 prior to $220.00.
Bank of America - Reports 16th July
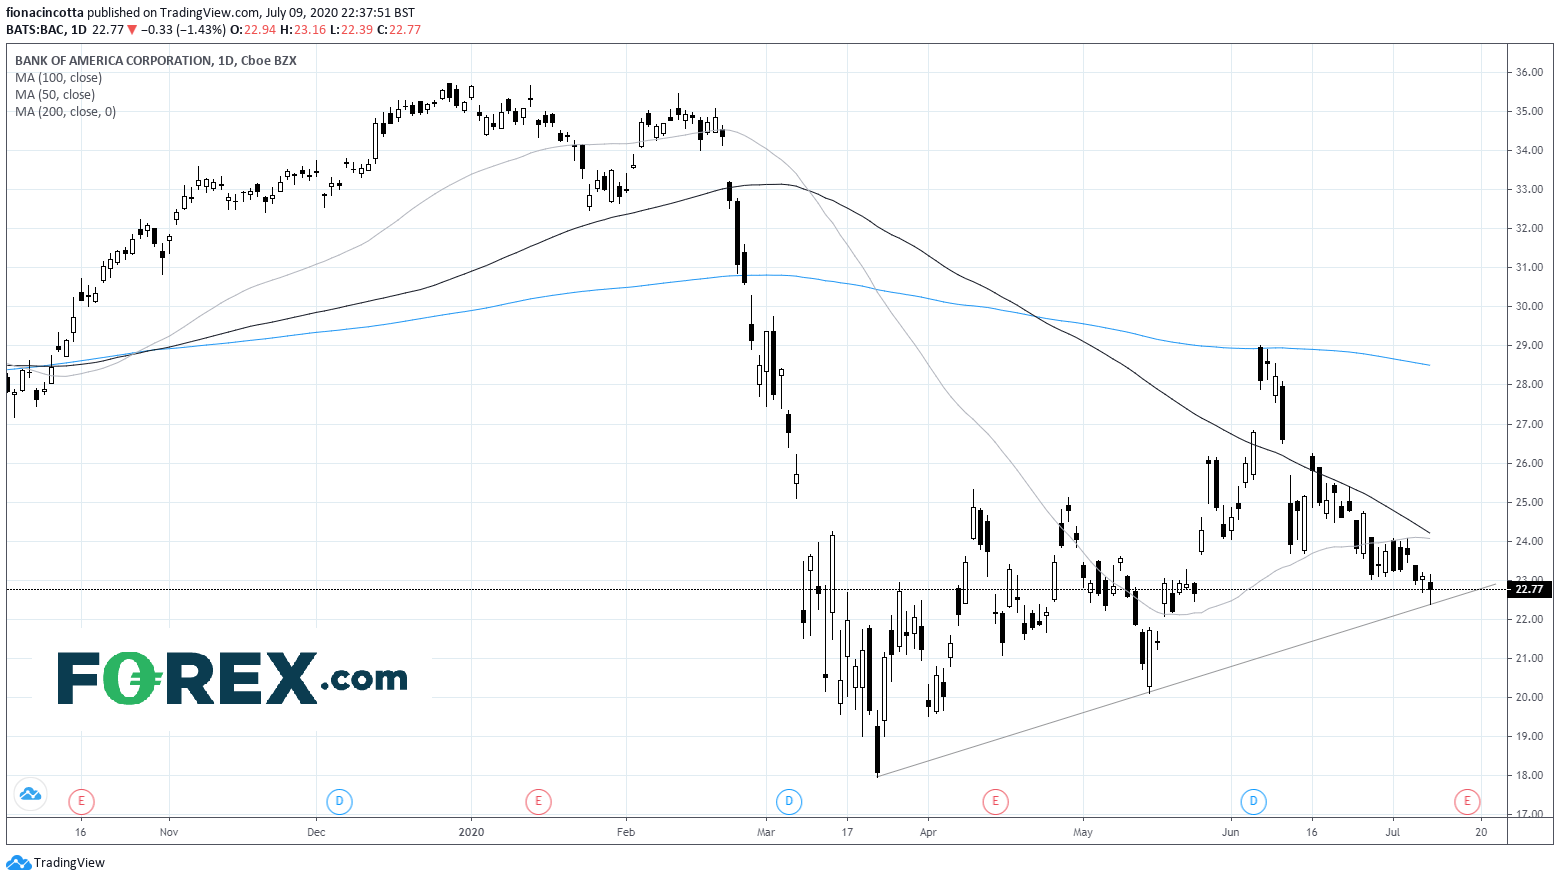
BoA trades below it 50, 100 & 200 daily moving average although the rising trend line from the march low is just about holding, for now. A close below trend line support at $22.5 could see more bears jump in and push the share price towards support at $20.00. A break above the 50& 100 sma around $24.00 could see fresh legs on the rally.
US Q2 earnings could be some of the most eagerly awaited reports in recent memory. Whilst Q1 earnings were a big deal, they only included a few short weeks of the coronavirus crisis, furthermore January and February were solid months.
The second quarter bore the brunt of the crisis, including lockdown. As a result, bank earnings are expected to be down around 70% compared to the previous year.
Revenue
Revenue is expected to take a bigger hit in Q2 compared to Q1. The Fed dropped interest rates to 0% in March meaning net interest income will be squeezed. M&A and IPO activity also dried up in the quarter amid lockdown restrictions.
On a positive note, mortgage activity could be a positive as refinancing surged as 10 year treasuries dropped to historic lows. Purchase mortgage activity is also showing signs of picking up as states reopen and this could be reflected in Q2 results.
Another plus point is expected to be impressive trading revenue amid high volatility owing to the coronavirus crises. However, there is a good chance that rising trading revenues will be offset by high bad loan provisions.
Bad loans
As companies’ default on borrowing or defer payments bad loans are expected to increase. Provisions for bad loans were eye watering n the first quarter, for some banks the amount that they need to set aside for bad loans has increased further in the second quarter. These bad loan provisions cut directly into profits. With no V-shaped recovery in sight and a long rocky road to recovery bad loans could continue to drag on bank’s profits for some time to come.
Guidance
Most banks withdrew their guidance for the year given the extreme levels of uncertainty. Since then, there has been a lot more data released, and banks will also have more data on their customers as well. The big question is whether banks will provide guidance for the remainder of the year? The outlook is still very uncertain. However, the banks could well have seen an improvement in the last few weeks of the quarter as lock down measure ease and this could give them confidence to provide some type of outlook across the coming quarters.
Chart thoughts
JP Morgan - Reports 14th July
The stock trades -20% YTD, under performing the broader market. Whilst the ascending trendline is just about holding, JP Morgan trades below its 50, 100 & 200 daily moving averages. $90 has proved to be an important level for the stock over the past 6 months. Should $90 hold as support the share price could look to attack $96.00 (50 sma). A break below $90.00 could open the door to support at $88.00.
Wells Fargo - Reports 14th July
Wells Fargo is the only bank which has failed to pick up from March lows, instead the stock tanked further towards a May nadir. The stock trades below its 50, 100 &200 daily moving average and below its descending trendline, targeting the May low of $22.00. A break above 50 sma at $27 could see more upside to come.
Citigroup - Reports 14th July
Up an impressive 66% from March lows, Citi has so far outperformed its peers in the recovery. However, the stock is still down 30% YTD, significantly more than Goldman Sachs which is now just down -4% YTD.
Citigroup sits at a crucial point $49.5/ $50.00 on the chart, testing its 50 and 100 sma and its ascending trendline.
Goldman Sachs - Reports 15th July
Goldman Sachs has seen an impressive run from March lows in the region of 50% from Thursday’s close. The price trades above its 100 daily moving average and the 50 ma is holding, offering support at $294, Thursday’s low. The ascending trendline also holds around that same 194.00 level. A breath through here could negate the current uptrend and open the door to the 100 ma at $187.00.
Should the trend line and 50 ma hold, Goldman’s could look to attach the 200 ma at $205.00 prior to $220.00.
Bank of America - Reports 16th July
BoA trades below it 50, 100 & 200 daily moving average although the rising trend line from the march low is just about holding, for now. A close below trend line support at $22.5 could see more bears jump in and push the share price towards support at $20.00. A break above the 50& 100 sma around $24.00 could see fresh legs on the rally.
Related tags:




The complete CFD trading experience
Award-winning platforms, competitive spreads, low commissions and dedicated support.
We live and breathe the markets and are dedicated to helping traders realise their ambitions as we continue to set the industry bar.
Economic calendar
Web Trader platform
Our sophisticated web-based platform is packed with features.
Related articles

S&P 500, Nasdaq, Dow Forecast: Rising Yields Test Rally Ahead of Nvidia, Fed 8 22 2026
S&P 500, Nasdaq and Dow test key technical levels as momentum fades, raising the risk of a deeper correction heading into a pivotal week.


Magnificent Seven Earnings Preview: Can Big Tech Reclaim AI Leadership?
The Magnificent Seven enter earnings with far more divided performance than in previous years, as investors increasingly distinguish between companies supplying the AI buildout and those funding it - what does that mean heading into earnings season?


USD/JPY unwind accelerates as GPIF headlines spark yen buying
Japanese assets are rallying after the government floated the prospect of the GPIF investing more heavily at home. While the proposal could have significant implications for global capital flows, it does not yet change the broader forces driving Japanese bond yields and USD/JPY.
StoneX Europe Ltd may make third party material available on this website which may contain information included but not limited to the conditions of financial markets. The material is for information purposes only and does not contain, and should not be construed as containing, investment advice and/or investment recommendation and/or an investment research and/or an offer of or solicitation for any transactions in financial instruments; any decision to enter into a specific transaction shall be made by the client following an assessment by him/her of their situation.
StoneX Europe Ltd makes no representation or warranty and assumes no liability as to the accuracy or completeness of the information provided, nor any loss arising from any investment based on a recommendation, forecast or other information supplied. You should always seek independent advice as to your suitability to speculate in any related markets and your ability to assume the associated risks, if you are at all unsure. We are not under any obligation to update any such material. Any opinion made may be personal to the author and may not reflect the opinion of StoneX Europe Ltd.