






US China Trade Deal FINALLY Here
After today, markets will try and figure out “What’s next?”.
Share this:

Today is the day the United States and China have been preparing for…the day the two countries sign “Phase One” of the US-China trade deal. President Trump and the China lead negotiator for the deal, Liu He, will meet in Washington today to formally sign the deal.
The markets already know what Phase One is all about… primarily, larger agriculture purchases by China from the US in exchange for “some” tariff reductions. China also was un-designated by the US as a currency manipulator. However, as my colleague Matt wrote about earlier, tariffs are expected to remain in place. What does that mean for the stock markets and the fx markets moving forward? There have been comments and speculation that “Phase Two” of the deal may not begin to after the US Presidential election in November. As such, the markets may be left in limbo until the election.
Yesterday, when discussing the CPI data we addressed the DXY. We noted how there was a confluence of resistance and it was that it was decision time for the DXY. It is not a surprise that this coincided with the signing of the trade deal, as markets are deciding what to next. If the uncertainty of the trade deal is out of the way and China is longer a “currency manipulator”, one would the value of the US Dollar to weaken as the Chinese Yuan strengthens.
Source: Tradingview, City Index
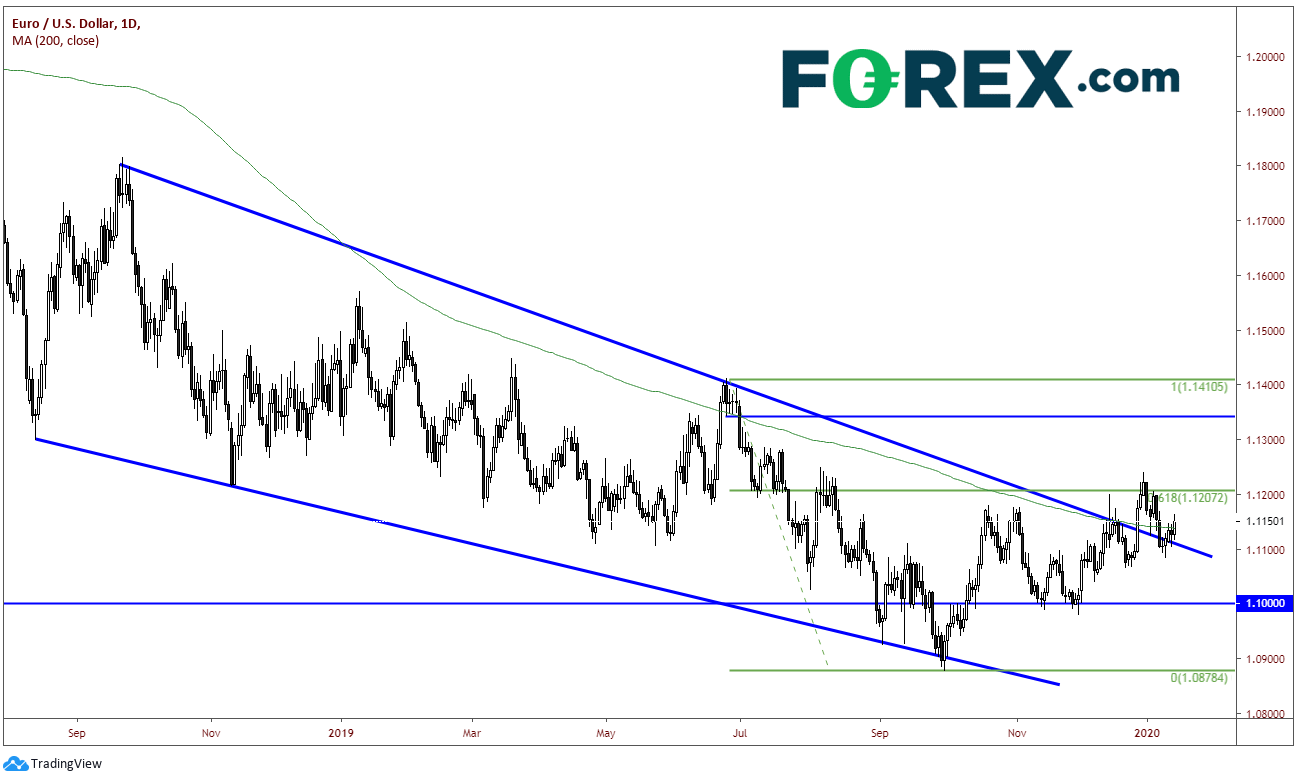
Today the DXY is moving lower, as it could not push through this resistance level. As a result, EUR/USD is pushing higher, back above the downward sloping trendline of the long-term wedge price has been in since the second half of 2018, near 1.1150. The 200 Day Moving Average also comes in near this level at 1.1139.
Source: Tradingview, City Index
The S&P 500 has been moving in an upward sloping channel since early October 2019, and continues to put in new all-time highs, currently near 3300. But one should consider today’s signing could be a “buy the rumor, sell the fact”, as price is currently near the top of the upward sloping trendline of the channel, as well as, the Golden Fib level of 161.8% retracement of the move lower from Q4 2018 near 3335. In addition, the RSI is diverging from price, an indication of a possible reversal.
Source: Tradingview, CME, City Index
After today, markets will try and figure out “What’s next?”. If data confirms that both the US and China are holding up their ends of the deal, stocks may continue to rise and the DXY may continue lower (with USD/CNH). However, if it is determined either side is not living up to expectations, stocks could head lower and the DXY could be on the rise again.
Today is the day the United States and China have been preparing for…the day the two countries sign “Phase One” of the US-China trade deal. President Trump and the China lead negotiator for the deal, Liu He, will meet in Washington today to formally sign the deal.
The markets already know what Phase One is all about… primarily, larger agriculture purchases by China from the US in exchange for “some” tariff reductions. China also was un-designated by the US as a currency manipulator. However, as my colleague Matt wrote about earlier, tariffs are expected to remain in place. What does that mean for the stock markets and the fx markets moving forward? There have been comments and speculation that “Phase Two” of the deal may not begin to after the US Presidential election in November. As such, the markets may be left in limbo until the election.
Yesterday, when discussing the CPI data we addressed the DXY. We noted how there was a confluence of resistance and it was that it was decision time for the DXY. It is not a surprise that this coincided with the signing of the trade deal, as markets are deciding what to next. If the uncertainty of the trade deal is out of the way and China is longer a “currency manipulator”, one would the value of the US Dollar to weaken as the Chinese Yuan strengthens.
Source: Tradingview, FOREX.com
Today the DXY is moving lower, as it could not push through this resistance level. As a result, EUR/USD is pushing higher, back above the downward sloping trendline of the long-term wedge price has been in since the second half of 2018, near 1.1150. The 200 Day Moving Average also comes in near this level at 1.1139.
Source: Tradingview, FOREX.com
The S&P 500 has been moving in an upward sloping channel since early October 2019, and continues to put in new all-time highs, currently near 3300. But one should consider today’s signing could be a “buy the rumor, sell the fact”, as price is currently near the top of the upward sloping trendline of the channel, as well as, the Golden Fib level of 161.8% retracement of the move lower from Q4 2018 near 3335. In addition, the RSI is diverging from price, an indication of a possible reversal.
Source: Tradingview, CME, FOREX.com
After today, markets will try and figure out “What’s next?”. If data confirms that both the US and China are holding up their ends of the deal, stocks may continue to rise and the DXY may continue lower (with USD/CNH). However, if it is determined either side is not living up to expectations, stocks could head lower and the DXY could be on the rise again.



The complete CFD trading experience
Award-winning platforms, competitive spreads, low commissions and dedicated support.
We live and breathe the markets and are dedicated to helping traders realise their ambitions as we continue to set the industry bar.
Economic calendar
Web Trader platform
Our sophisticated web-based platform is packed with features.
Related articles

AUD/USD forecast: Currency Pair of the Week | September 28, 2026
The week has started with stocks, gold, silver and bitcoin all falling, as crude oil rebounded and bond yields pushed further higher. Trump refusing to agree to Tehran’s proposal to re-open the Strait of Hormuz has left the markets disappointed. Still, reports that mediators are expected to hold talks with the two sides on an amended version of the 7-day proposal that Iran presented, keeps hopes alive that we may see some progress.


EUR/USD weekly outlook: Oil, inflation and NFP in focus
After coming under significant pressure in recent weeks, the EUR/USD came off its lows to finish the week on a positive note on Friday, albeit with only a mild rebound. That was not enough to prevent the exchange rate falling for the third consecutive week, as the US dollar and bond yields rallied across the board.

USD/JPY Weekly Outlook: Payrolls loom as US rates remain the dominant driver
Strong US growth and hawkish Fed pricing continue to support USD/JPY, while intervention risk appears to be kicking in at lower levels

StoneX Europe Ltd may make third party material available on this website which may contain information included but not limited to the conditions of financial markets. The material is for information purposes only and does not contain, and should not be construed as containing, investment advice and/or investment recommendation and/or an investment research and/or an offer of or solicitation for any transactions in financial instruments; any decision to enter into a specific transaction shall be made by the client following an assessment by him/her of their situation.
StoneX Europe Ltd makes no representation or warranty and assumes no liability as to the accuracy or completeness of the information provided, nor any loss arising from any investment based on a recommendation, forecast or other information supplied. You should always seek independent advice as to your suitability to speculate in any related markets and your ability to assume the associated risks, if you are at all unsure. We are not under any obligation to update any such material. Any opinion made may be personal to the author and may not reflect the opinion of StoneX Europe Ltd.