



US Dollar Fake out?
USD/CHF has a strong correlation with the DXY. Therefore, if one wishes to trade a currency pair rather then the US Dollar Index, USD/CHF could be a good choice!
Share this:

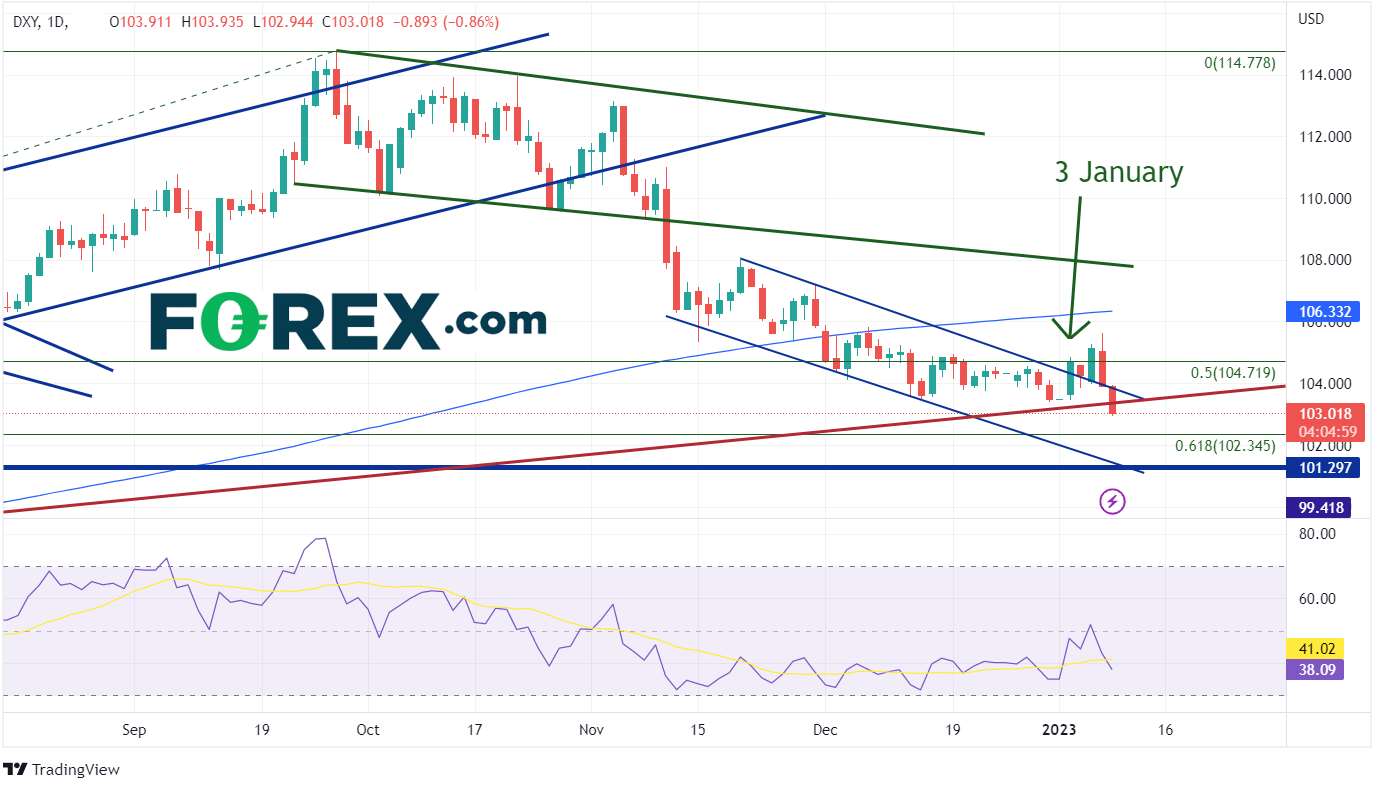
The US Dollar Index (DXY) reached it highest level in 20 years on September 28th at 114.78. Since then, the index has been moving lower. Most recently, the DXY has been moving lower in an orderly downward sloping channel from November 21st, 2022, when price made a near-term high at 107.99. Price then struggled to break below the 50% retracement level from the lows of January 2022 to the highs of September 2022 near 104.72. However, as the new year arrived, the direction of the DXY looked like it may be changing. On January 3rd, the DXY broke out above the top trendline of the channel and continued higher until January 5th. However, Average Hourly Earnings and US Non-Manufacturing PMI was released on Friday and suggested that the Fed may turn less hawkish. As a result, price fell back towards the top trendline of the previous channel. On Monday, not only did the DXY break back into the channel, but it also broke below a long-term trendline dating to May 2021. Was this a false breakout above the top of the channel? If so, often when price fails to break out of one side of a pattern it moves to test the opposite side. Therefore, the target on the downside for the DXY is near 101.30, which is also the lows from May 30th, 2022. If price is to get there, it must first pass-through support at the 61.8% Fibonacci retracement from the above-mentioned time frame. If price bounces, resistance is at the top trendline of the channel and today’s high at 103.94. Above there, the DXY can move to yesterday’s high of 105.63, then the 200 Day Moving Average at 106.33.
Source: Tradingview, Stone X
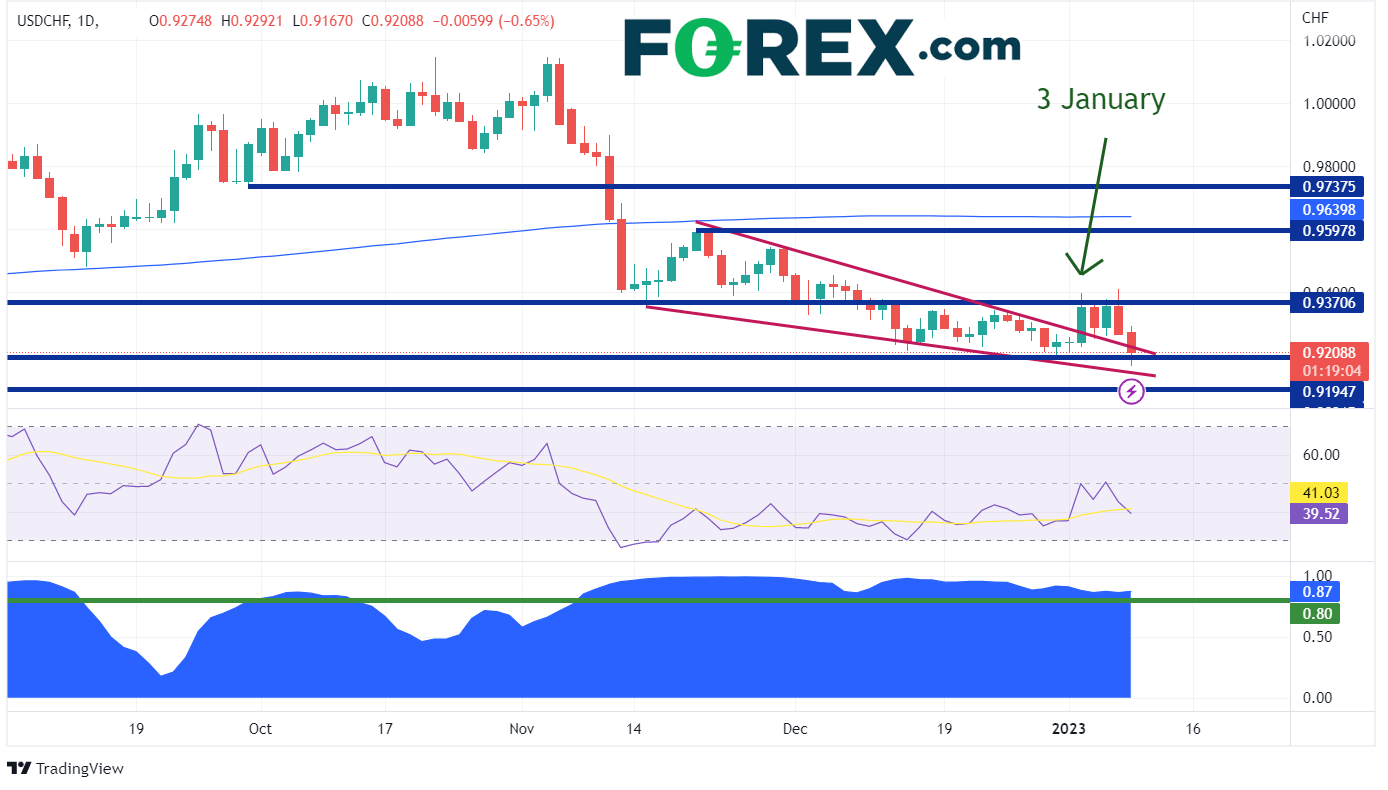
If fx traders are looking to trade an fx pair, rather than the US Dollar Index, USD/CHF is the place to look. The pair has a strong positive correlation with the DXY, as shown in the panel at the bottom of the chart below. The current correlation coefficient between the 2 assets is +0.88. Correlations with a reading above +0.80 are considered to be strong, positive correlations. Therefore, if the DXY moves in one direction, USD/CHF tends to move in the same direction.
Source: Tradingview, Stone X
On November 21st, 2022, as the DXY was making a near-term high, so was USD/CHF near 0.9598. However, as the DXY was trading in a downward sloping channel, USD/CHF was trading in a descending wedge formation. On January 3rd, price moved above the top trendline of the wedge, just as the DXY moved above the channel. Today, USD/CHF moved back into the wedge, just as the DXY moved back into the channel. If this move does prove to be a false breakout above the wedge, price could move to the other side of the wedge, which is near 0.9140. The 2022 low is just below there at 0.9192. Resistance is at today’s high of 0.9167, then yesterday’s high of 0.9409. If USD/CHF moves above there, the next resistance level isn’t until November 21st highs at 0.9598.
The DXY may be posting a false breakout above the top trendline of the near-term channel. If so, the target is the bottom side of the channel. USD/CHF has a strong correlation with the DXY. Therefore, if one wishes to trade a currency pair rather then the US Dollar Index, USD/CHF could be a good choice!
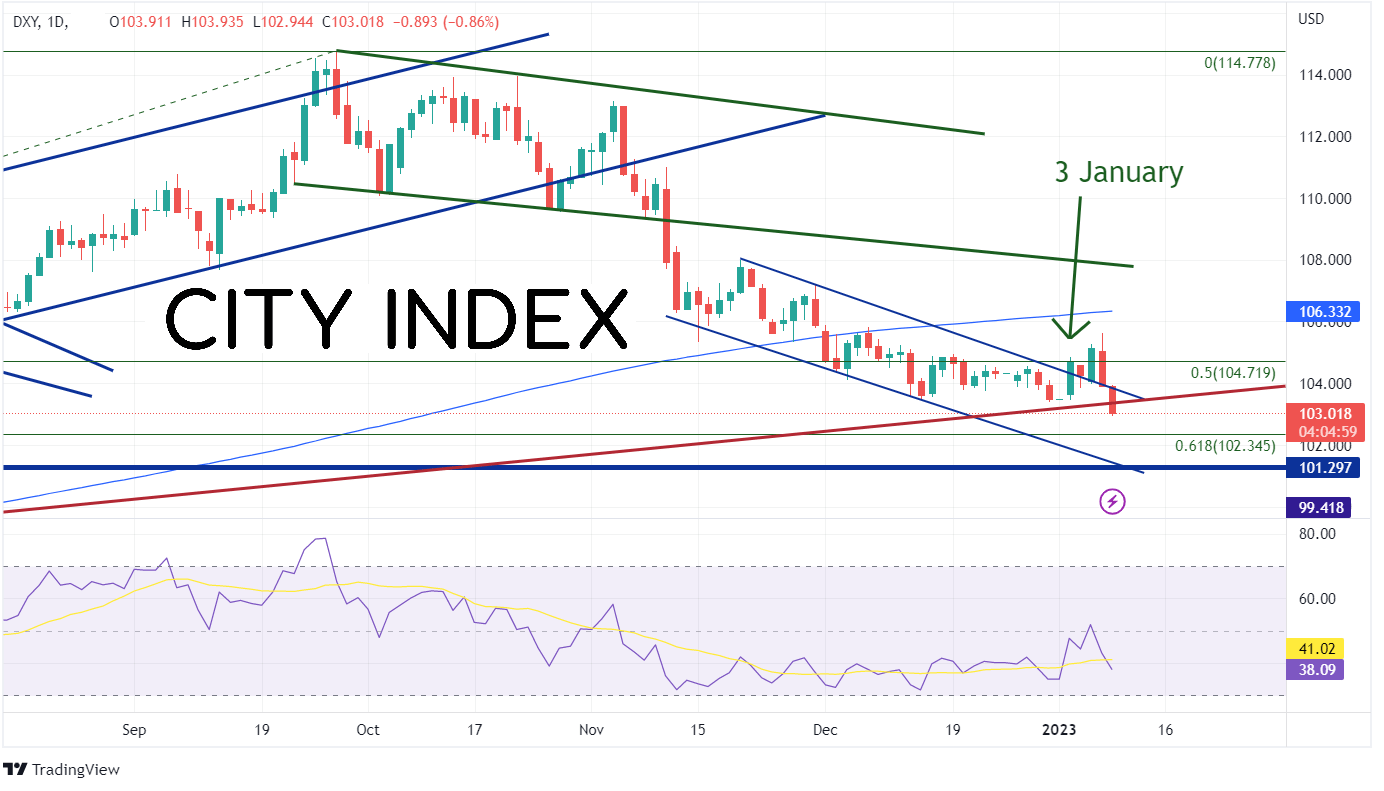
The US Dollar Index (DXY) reached it highest level in 20 years on September 28th at 114.78. Since then, the index has been moving lower. Most recently, the DXY has been moving lower in an orderly downward sloping channel from November 21st, 2022, when price made a near-term high at 107.99. Price then struggled to break below the 50% retracement level from the lows of January 2022 to the highs of September 2022 near 104.72. However, as the new year arrived, the direction of the DXY looked like it may be changing. On January 3rd, the DXY broke out above the top trendline of the channel and continued higher until January 5th. However, Average Hourly Earnings and US Non-Manufacturing PMI was released on Friday and suggested that the Fed may turn less hawkish. As a result, price fell back towards the top trendline of the previous channel. On Monday, not only did the DXY break back into the channel, but it also broke below a long-term trendline dating to May 2021. Was this a false breakout above the top of the channel? If so, often when price fails to break out of one side of a pattern it moves to test the opposite side. Therefore, the target on the downside for the DXY is near 101.30, which is also the lows from May 30th, 2022. If price is to get there, it must first pass-through support at the 61.8% Fibonacci retracement from the above-mentioned time frame. If price bounces, resistance is at the top trendline of the channel and today’s high at 103.94. Above there, the DXY can move to yesterday’s high of 105.63, then the 200 Day Moving Average at 106.33.
Source: Tradingview, Stone X
Trade DXY now: Login or Open a new account!
• Open an account in the UK
• Open an account in Australia
• Open an account in Singapore
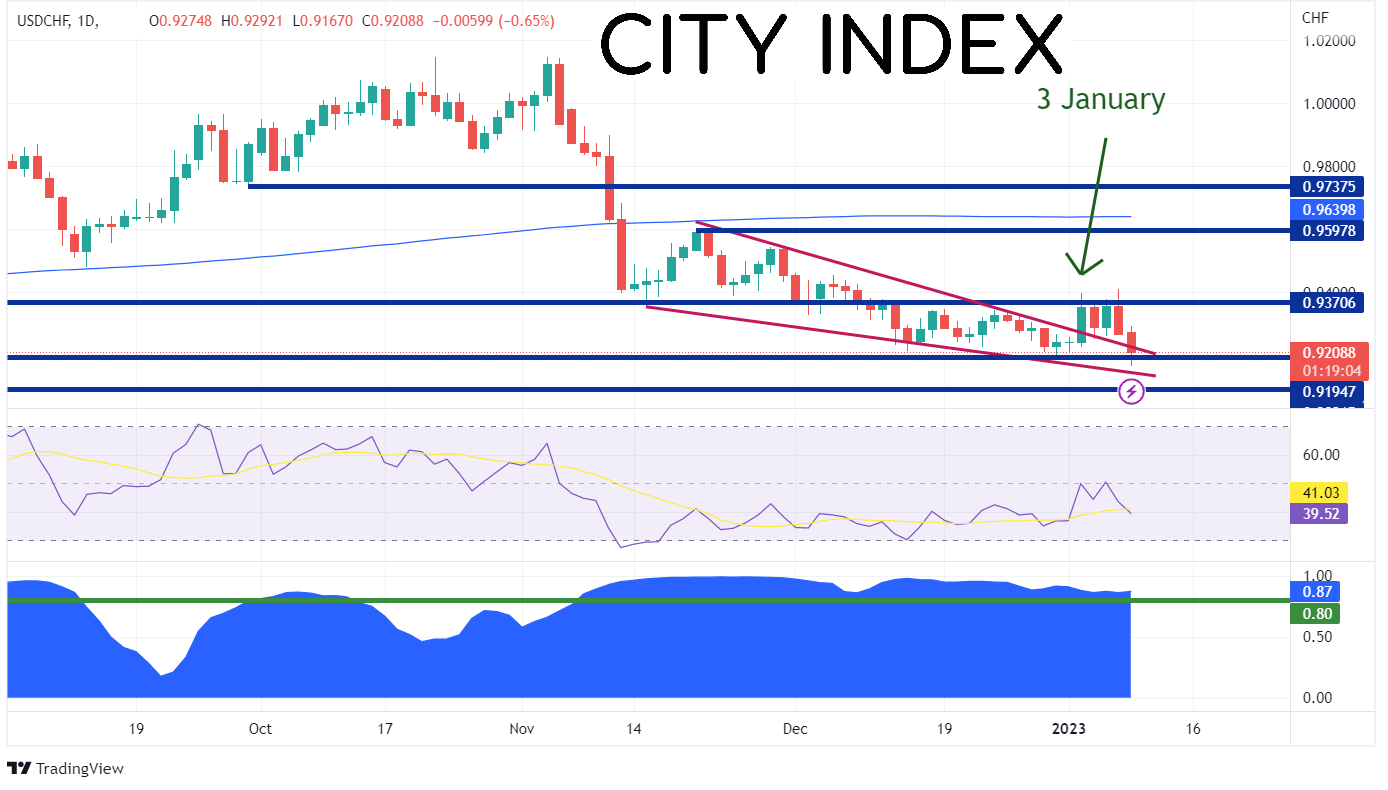
If fx traders are looking to trade an fx pair, rather than the US Dollar Index, USD/CHF is the place to look. The pair has a strong positive correlation with the DXY, as shown in the panel at the bottom of the chart below. The current correlation coefficient between the 2 assets is +0.88. Correlations with a reading above +0.80 are considered to be strong, positive correlations. Therefore, if the DXY moves in one direction, USD/CHF tends to move in the same direction.
Source: Tradingview, Stone X
On November 21st, 2022, as the DXY was making a near-term high, so was USD/CHF near 0.9598. However, as the DXY was trading in a downward sloping channel, USD/CHF was trading in a descending wedge formation. On January 3rd, price moved above the top trendline of the wedge, just as the DXY moved above the channel. Today, USD/CHF moved back into the wedge, just as the DXY moved back into the channel. If this move does prove to be a false breakout above the wedge, price could move to the other side of the wedge, which is near 0.9140. The 2022 low is just below there at 0.9192. Resistance is at today’s high of 0.9167, then yesterday’s high of 0.9409. If USD/CHF moves above there, the next resistance level isn’t until November 21st highs at 0.9598.
Trade USD/CHF now: Login or Open a new account!
• Open an account in the UK
• Open an account in Australia
• Open an account in Singapore
The DXY may be posting a false breakout above the top trendline of the near-term channel. If so, the target is the bottom side of the channel. USD/CHF has a strong correlation with the DXY. Therefore, if one wishes to trade a currency pair rather then the US Dollar Index, USD/CHF could be a good choice!
Learn more about forex trading opportunities.
Related tags:
Latest market news




The complete CFD trading experience
Award-winning platforms, competitive spreads, low commissions and dedicated support.
We live and breathe the markets and are dedicated to helping traders realise their ambitions as we continue to set the industry bar.
Economic calendar
Web Trader platform
Our sophisticated web-based platform is packed with features.
Related articles
Gold Outlook: XAU/USD hit hard as US yields, dollar resume ascent
A stronger dollar, surging front-end yields and renewed geopolitical tension have combined to push gold back towards key technical support.
EUR/USD weekly outlook: Oil, inflation and NFP in focus
After coming under significant pressure in recent weeks, the EUR/USD came off its lows to finish the week on a positive note on Friday, albeit with only a mild rebound. That was not enough to prevent the exchange rate falling for the third consecutive week, as the US dollar and bond yields rallied across the board.


USD/JPY Weekly Outlook: Payrolls loom as US rates remain the dominant driver
Strong US growth and hawkish Fed pricing continue to support USD/JPY, while intervention risk appears to be kicking in at lower levels
StoneX Europe Ltd may make third party material available on this website which may contain information included but not limited to the conditions of financial markets. The material is for information purposes only and does not contain, and should not be construed as containing, investment advice and/or investment recommendation and/or an investment research and/or an offer of or solicitation for any transactions in financial instruments; any decision to enter into a specific transaction shall be made by the client following an assessment by him/her of their situation.
StoneX Europe Ltd makes no representation or warranty and assumes no liability as to the accuracy or completeness of the information provided, nor any loss arising from any investment based on a recommendation, forecast or other information supplied. You should always seek independent advice as to your suitability to speculate in any related markets and your ability to assume the associated risks, if you are at all unsure. We are not under any obligation to update any such material. Any opinion made may be personal to the author and may not reflect the opinion of StoneX Europe Ltd.