



US October PPI follows the CPI lower
Both the CPI and PPI are pointing towards a slowdown in the pace of interest rate hikes for the Fed, to 50bps from 75bps.
Share this:

Last week, the US released October CPI at 7.7% YoY vs an expectation of 8.0% YoY. On Tuesday morning, the US followed with additional inflation data, October PPI. The expectation was for a YoY print of 8.3%. However, the actual print was lower at 8%, much lower than the 8.4% YoY print in September. In addition, the Core PPI YoY print for October was 6.7% vs an expectation of 7.2%. The previous September reading was 7.2%. Since the FOMC November meeting, Fed speakers have been on the wires discussing a possible slowdown in the pace of increases in the Fed Funds rate hikes. On Monday, Fed’s Brainard said that “it will probably be appropriate soon to move to a slower pace of increases.” But is the lower inflation data from the last 2 weeks enough to make the Fed lower the pace of interest rate increases from 75bps to “only” 50bps? According to the CME Fedwatch tool, the markets are pricing in an 85.4% chance of a 50bps rate hike at the December 14th meeting. Before the CPI data last week, markets had been looking for roughly a 50/50 chance of a 50bps rate hike and a 75bps rate hike.

Source: CME
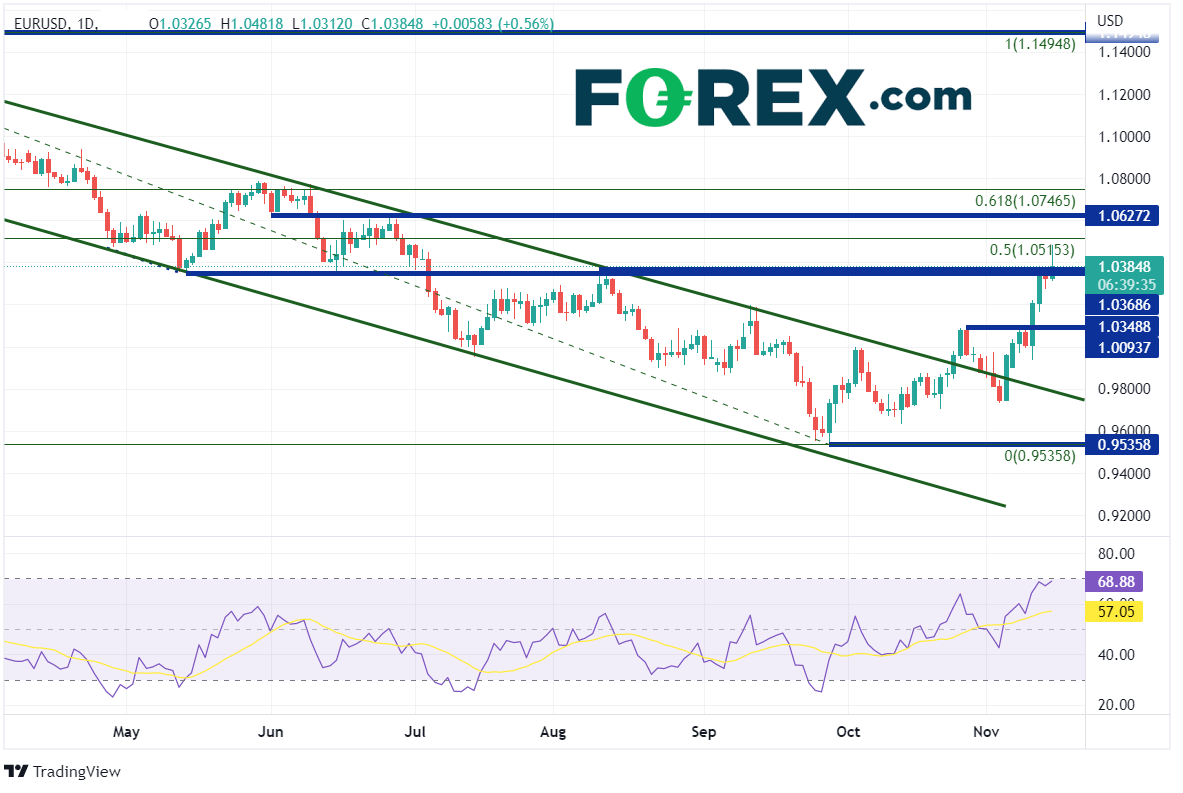
EUR/USD had been moving lower in an orderly channel since February when the pair reached a Year-to-Date high of 1.1495. On September 28th, the pair reached a low of 0.9536, testing the bottom trendline of the channel. The pair bounced and broke about the top trendline of the channel on October 25th, near 0.9975. EUR/USD moved through strong resistance near 1.0350/70and traded to an intra-day high of 1.0482.
Source: Tradingview, Stone X
On a 240-minute timeframe, the 50% retracement level from the February highs to the September lows crosses just above at 1.0515. Above there, the next level of resistance is at the lows of June 1st at 1.0627 and then the 61.8% Fibonacci retracement level from the recently mentioned timeframe at 1.0747. Support sits just below at the previous resistance zone of 1.0350/70. Below there EUR/USD can fall to previous highs at 1.0094. The next support level is the lows from November 10th at 0.9936.

Source: Tradingview, Stone X
The lower-than-expected PPI print for October is consistent with the CPI from last week. Both are pointing towards a slowdown in the pace of interest rate hikes for the Fed, to 50bps from 75bps. However, Core PCE and another CPI print will be released before then. Keep an eye on the inflation data to see if there is anything that may cause the Fed to hike by more than 50bps!
Last week, the US released October CPI at 7.7% YoY vs an expectation of 8.0% YoY. On Tuesday morning, the US followed with additional inflation data, October PPI. The expectation was for a YoY print of 8.3%. However, the actual print was lower at 8%, much lower than the 8.4% YoY print in September. In addition, the Core PPI YoY print for October was 6.7% vs an expectation of 7.2%. The previous September reading was 7.2%. Since the FOMC November meeting, Fed speakers have been on the wires discussing a possible slowdown in the pace of increases in the Fed Funds rate hikes. On Monday, Fed’s Brainard said that “it will probably be appropriate soon to move to a slower pace of increases.” But is the lower inflation data from the last 2 weeks enough to make the Fed lower the pace of interest rate increases from 75bps to “only” 50bps? According to the CME Fedwatch tool, the markets are pricing in an 85.4% chance of a 50bps rate hike at the December 14th meeting. Before the CPI data last week, markets had been looking for roughly a 50/50 chance of a 50bps rate hike and a 75bps rate hike.

Source: CME
EUR/USD had been moving lower in an orderly channel since February when the pair reached a Year-to-Date high of 1.1495. On September 28th, the pair reached a low of 0.9536, testing the bottom trendline of the channel. The pair bounced and broke about the top trendline of the channel on October 25th, near 0.9975. EUR/USD moved through strong resistance near 1.0350/70and traded to an intra-day high of 1.0482.

Source: Tradingview, Stone X
Trade EUR/USD now: Login or Open a new account!
• Open an account in the UK
• Open an account in Australia
• Open an account in Singapore
On a 240-minute timeframe, the 50% retracement level from the February highs to the September lows crosses just above at 1.0515. Above there, the next level of resistance is at the lows of June 1st at 1.0627 and then the 61.8% Fibonacci retracement level from the recently mentioned timeframe at 1.0747. Support sits just below at the previous resistance zone of 1.0350/70. Below there EUR/USD can fall to previous highs at 1.0094. The next support level is the lows from November 10th at 0.9936.

Source: Tradingview, Stone X
The lower-than-expected PPI print for October is consistent with the CPI from last week. Both are pointing towards a slowdown in the pace of interest rate hikes for the Fed, to 50bps from 75bps. However, Core PCE and another CPI print will be released before then. Keep an eye on the inflation data to see if there is anything that may cause the Fed to hike by more than 50bps!
Learn more about forex trading opportunities.
Related tags:

The complete CFD trading experience
Award-winning platforms, competitive spreads, low commissions and dedicated support.
We live and breathe the markets and are dedicated to helping traders realise their ambitions as we continue to set the industry bar.
Economic calendar
Web Trader platform
Our sophisticated web-based platform is packed with features.
Related articles

Gold forecast: XAU/USD could take a larger dive after the big rise in yields
Gold prices have been falling in the last few days after last week’s post-FOMC pop faded amid rising interest rate expectations, higher oil prices and a strengthening US dollar. As before, I wasn’t convinced gold would thrive in the current macro backdrop.


USD/JPY outlook: Hawkish Fed recalibration pressures the yen
Stronger US growth momentum and rising Treasury yields are keeping USD/JPY pointed higher, even as Japanese policymakers try to limit the pressure building across domestic markets.


Gold, silver slammed as hawkish Fed repricing reignites dollar upside
Gold and silver had held up surprisingly well against surging US yields. Wednesday’s DXY breakout may have changed that equation.
StoneX Europe Ltd may make third party material available on this website which may contain information included but not limited to the conditions of financial markets. The material is for information purposes only and does not contain, and should not be construed as containing, investment advice and/or investment recommendation and/or an investment research and/or an offer of or solicitation for any transactions in financial instruments; any decision to enter into a specific transaction shall be made by the client following an assessment by him/her of their situation.
StoneX Europe Ltd makes no representation or warranty and assumes no liability as to the accuracy or completeness of the information provided, nor any loss arising from any investment based on a recommendation, forecast or other information supplied. You should always seek independent advice as to your suitability to speculate in any related markets and your ability to assume the associated risks, if you are at all unsure. We are not under any obligation to update any such material. Any opinion made may be personal to the author and may not reflect the opinion of StoneX Europe Ltd.