




USD/JPY analysis: Asian Open – 4th September 2023
USD/JPY managed to produce a bullish engulfing / outside day on Friday, despite a mixed Nonfarm payrolls report seeing money markets price in a 93% probability of the Fed holding rates steady at their next meeting.
Share this:

Market Summary:
- Nonfarm payrolls was mixed on Friday, with 187k jobs added above the 170k expected yet unemployment rose to 3.8% - its highest level since February 2022. Weekly hours rose to 34.4 (34.3 expected and previous) yet average earnings slipped to 0.2% m/m (0.3% expected, 0.4% previous)
- Money markets suggest the Fed are done with hiking rates, with the 30-day Fed Fund futures implying a 93% chance of the Fed holding rates in September
- However, bond yields and the US dollar gave a contradictory reaction, with both initially falling after the NFP release before reversing and posting strong rallies
- The US yield curve from the 2-year and higher all rose, particularly at the long end with the 20 and 30-year yields rising 8.7 and 8.1 bps respectively
- EUR/USD declined for a seventh consecutive week and closed firmly below 1.08, which is its most bearish sequence since October 2014
- The US dollar index reversed all losses sustained between Monday and Wednesday on Thursday and Friday, and closed just beneath its weekly high
- Canada’s GDP unexpectedly contracted in Q2 by 0.2% q/q, compared with 1.2% expected and 2.6% prior (downgraded from 3.1%). This all but confirms that the Bank of Canada (BOC) will likely hold rates at 5% this week.
- US manufacturing contracted at a slower pace according to two surveys on Friday. The S&P Global final PMI was at 76.6, above 47 expected and 46.4 prior. The ISM manufacturing PMI survey was at 48.4, compared with 43.9 expected and 42.6 previously.
- Output concerns saw WTI crude oil rise to a 9-month high and rally for a seventh consecutive day on Friday, which is its most bullish daily sequence since January.
- Russia agreed with OPEC+ to further cut is oil exports in October, adding to inflationary concerns. Manufacturing activity in China and the US were also stronger than expected last week.
- Gold rose for a second week, although t is showing signs of exhaustion around 1950 with a bearish pinbar forming on Friday


Events in focus (AEDT):
- It is a public holiday in the US and Canada (Labor Day)
- 11:00 – Australian inflation (Westpac-Melbourne Institute)
- 11:30 – Australian job ads (ANZ), company profits, business inventories
ASX 200 at a glance:
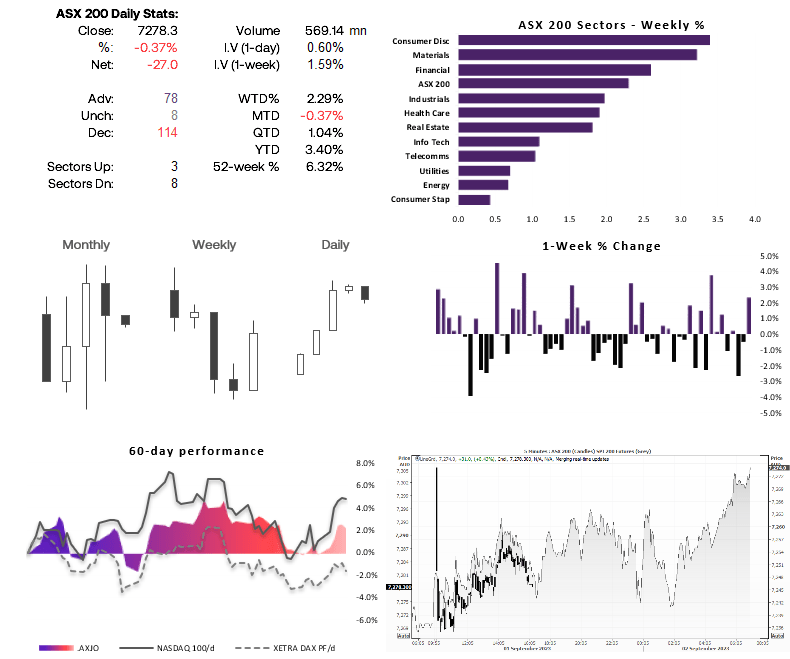
- The ASX 200 enjoyed its most bullish week in seven, with all 11 sectors rising (led by consumer discretionary and materials)
- Whilst Friday snapped a 4-day winning streak, SPI futures point to a positive open despite the soft lead from Wall Street
- Resistance levels include 7318-7320, 7330, 7362-7370
- Supper levels include 7250, 7260,7280

USD/JPY technical analysis (1-hour chart):
USD/JPY formed a Doji last week to show indecision around the cycle highs. And perhaps that can be expected, with the BOJ slowly beginning to make comments about the forex market. Yet a bullish outside / engulfing day formed on Friday to show strong demand around 144.50.
Whilst this paints an upside bias, bulls should be cautious around current levels given the levels of potential resistance nearby. Last week’s VPOC (volume point of control) resides around 146.59 – the level a soft US CPI print triggered an aggressive selloff and has acted as resistance since. Therefore, bulls may want to wait for a pullback before seeking longs at lower prices, such as the 145.55 area near the daily pivot point. If pries rally from the open, I’d prefer to wait to see if resistance holds and produces a pullback before reconsidering longs.
View the full economic calendar
View the full economic calendar
-- Written by Matt Simpson
Follow Matt on Twitter @cLeverEdge
How to trade with City Index
You can trade with City Index by following these four easy steps:
- Open an account, or log in if you’re already a customer
• Open an account in the UK
• Open an account in Australia
• Open an account in Singapore
- Search for the market you want to trade in our award-winning platform
- Choose your position and size, and your stop and limit levels
- Place the trade
Related tags:
Latest market news




The complete CFD trading experience
Award-winning platforms, competitive spreads, low commissions and dedicated support.
We live and breathe the markets and are dedicated to helping traders realise their ambitions as we continue to set the industry bar.
Economic calendar
Web Trader platform
Our sophisticated web-based platform is packed with features.
Related articles
USD/JPY Q4 2026 Outlook: Hawkish Fed Pricing Clashes With Intervention Risk
The year-end tug-of-war is clear: hawkish Fed pricing supports USD/JPY, while intervention risk limits the upside.


Japanese Yen Forecast: USD/JPY 4% Rally Challenges Post-Intervention Downtrend 9 24 2026
USD/JPY momentum has shifted sharply higher, putting a major resistance confluence in focus as U.S. and Japanese event risk builds.


Oil Quietly Hands the Fed a Reason to Stay Hawkish
Oil prices and the U.S. dollar are both on the front foot as elevated energy costs feed Fed warnings that inflation may prove sticky.

StoneX Europe Ltd may make third party material available on this website which may contain information included but not limited to the conditions of financial markets. The material is for information purposes only and does not contain, and should not be construed as containing, investment advice and/or investment recommendation and/or an investment research and/or an offer of or solicitation for any transactions in financial instruments; any decision to enter into a specific transaction shall be made by the client following an assessment by him/her of their situation.
StoneX Europe Ltd makes no representation or warranty and assumes no liability as to the accuracy or completeness of the information provided, nor any loss arising from any investment based on a recommendation, forecast or other information supplied. You should always seek independent advice as to your suitability to speculate in any related markets and your ability to assume the associated risks, if you are at all unsure. We are not under any obligation to update any such material. Any opinion made may be personal to the author and may not reflect the opinion of StoneX Europe Ltd.