




USDCAD rally on the cards
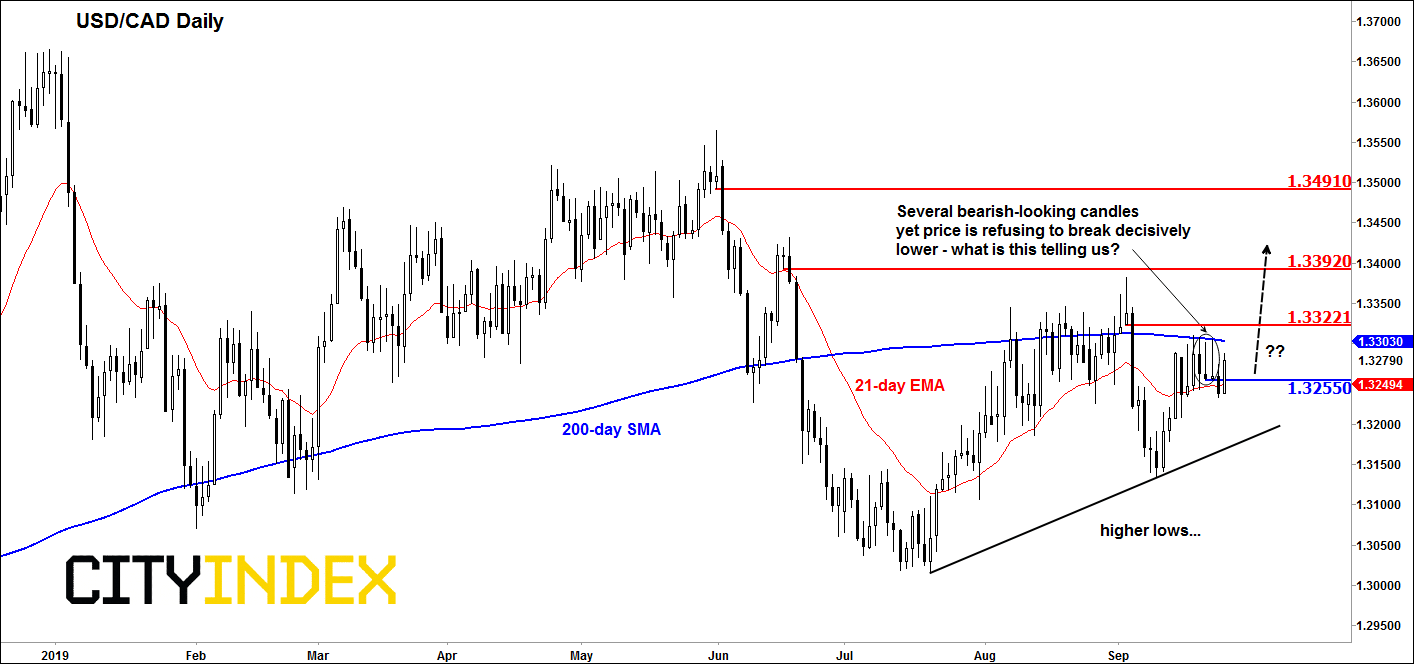
The USD/CAD has created several bearish-looking price candles on its daily chart below the 200-day moving average over the past few days. But...
Share this:

Our regular followers know that I am a price action trader/analyst and tend to build my ideas around what price is doing – or in some cases isn’t doing – either after some key fundamental event or following the formation of a particular price pattern. Now here is a perfect example of exactly what I am talking about. The USD/CAD has created several bearish-looking price candles on its daily chart below the 200-day moving average over the past few days. So, prior to today’s session, it would have been reasonable to expect further weakness in the exchange rate, particularly after support in the 1.3255 area gave way. Yet, after a brief break lower, price has turned positive on the day and broken not only back above the 1.3255 level, which should have turned into resistance, but also above yesterday’s high. It is therefore refusing to break lower. What is this telling you? Well, it is telling me that the USD/CAD is strong and that the sellers may have been trapped. So, I immediately ask myself this question: if the sellers are truly trapped, where are their stops likely to be resting? A logical area would be above those bearish looking candle and the 200-day moving average circa 1.3310. Now THIS is exactly where I would expect price to move to, if my thesis is correct. But this could turn out to be a more significant reversal and we could see an eventual move towards the levels shown on the chart. However, I would be quick to drop this bullish view in the event price turns lower and creates a new low on the day today. If that happens, just ignore my analysis and carry on with your life! Jokes aside, there are a lot of lessons you can take away from this. So, even if the analysis becomes invalid, you will have hopefully learned an alternative way of looking at price action.
Source: eSignal and City Index.
Our regular followers know that I am a price action trader/analyst and tend to build my ideas around what price is doing – or in some cases isn’t doing – either after some key fundamental event or following the formation of a particular price pattern. Now here is a perfect example of exactly what I am talking about. The USD/CAD has created several bearish-looking price candles on its daily chart below the 200-day moving average over the past few days. So, prior to today’s session, it would have been reasonable to expect further weakness in the exchange rate, particularly after support in the 1.3255 area gave way. Yet, after a brief break lower, price has turned positive on the day and broken not only back above the 1.3255 level, which should have turned into resistance, but also above yesterday’s high. It is therefore refusing to break lower. What is this telling you? Well, it is telling me that the USD/CAD is strong and that the sellers may have been trapped. So, I immediately ask myself this question: if the sellers are truly trapped, where are their stops likely to be resting? A logical area would be above those bearish looking candle and the 200-day moving average circa 1.3310. Now THIS is exactly where I would expect price to move to, if my thesis is correct. But this could turn out to be a more significant reversal and we could see an eventual move towards the levels shown on the chart. However, I would be quick to drop this bullish view in the event price turns lower and creates a new low on the day today. If that happens, just ignore my analysis and carry on with your life! Jokes aside, there are a lot of lessons you can take away from this. So, even if the analysis becomes invalid, you will have hopefully learned an alternative way of looking at price action.
Source: eSignal and FOREX.com.
Related tags:


The complete CFD trading experience
Award-winning platforms, competitive spreads, low commissions and dedicated support.
We live and breathe the markets and are dedicated to helping traders realise their ambitions as we continue to set the industry bar.
Economic calendar
Web Trader platform
Our sophisticated web-based platform is packed with features.
Related articles
Euro Short-term Outlook: EUR/USD Selloff Nears Critical Yearly Support 9 23 2026
Euro has fallen seven of the past nine sessions, with stretched momentum raising the stakes as EUR/USD closes in on a major inflection zone.

GBP/USD forecast: US dollar surges as bonds implode
The US dollar continued to press higher deep into the European session, supported by the slump in the bond markets as yields broke out across the curve. Following the recent hawkish Fed rate hike, yield spreads between the US and the rest of the world has continually increased, and that motion continued today, helped in part by some forecast-beating US macro data and hawkish Fed commentary.


Australian Dollar Technical Outlook: AUD/USD Breakdown Threatens Deeper Correction 9 23 2026
AUD/USD remains under pressure after breaking key trend support, with the latest decline putting the focus on the next major downside pivot.
StoneX Europe Ltd may make third party material available on this website which may contain information included but not limited to the conditions of financial markets. The material is for information purposes only and does not contain, and should not be construed as containing, investment advice and/or investment recommendation and/or an investment research and/or an offer of or solicitation for any transactions in financial instruments; any decision to enter into a specific transaction shall be made by the client following an assessment by him/her of their situation.
StoneX Europe Ltd makes no representation or warranty and assumes no liability as to the accuracy or completeness of the information provided, nor any loss arising from any investment based on a recommendation, forecast or other information supplied. You should always seek independent advice as to your suitability to speculate in any related markets and your ability to assume the associated risks, if you are at all unsure. We are not under any obligation to update any such material. Any opinion made may be personal to the author and may not reflect the opinion of StoneX Europe Ltd.