






USDCAD Retraces Most of Its Move Since Mid October
USD/CAD has reversed and retraced 78.6% of the move from mid-October.
Share this:

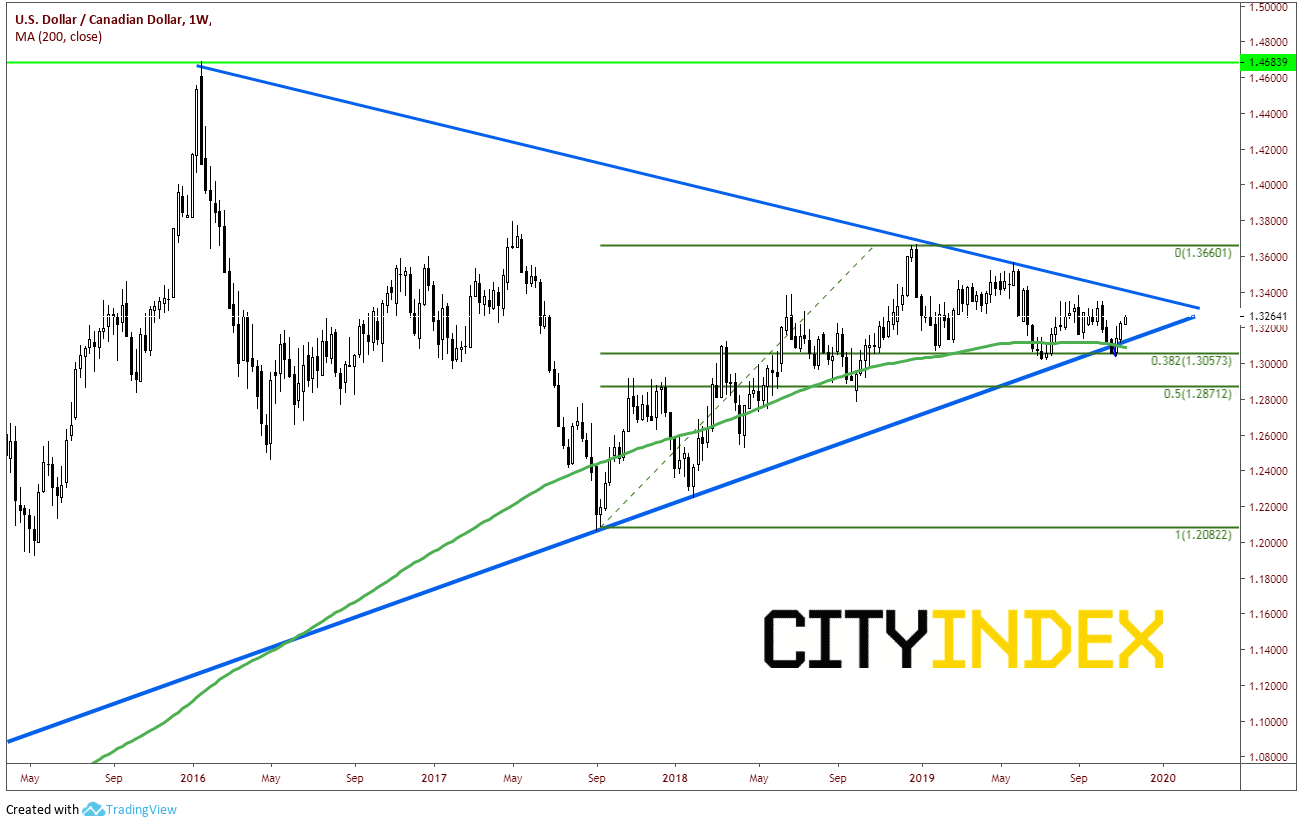
From October 10th to October 29th, USD/CAD was pushing lower from 1.3362 down to 1.3030, threatening to breakdown from the symmetrical triangle the pair has been in since early 2016.
Source: Tradingview, City Index
The market was pricing in a more hawkish BOC than the FOMC on October 30th, when both Committees coincidentally happened to be meeting on the same day. However, since the October 30th, USD/CAD has reversed and retraced 78.6% of the move from mid-October. So, what has changed?
First is that although the BOC left rates unchanged, they lowered their growth outlook. They were less hawkish then expected, and therefore, send USD/CAD bid off the lows. Second is that the Canadian data from since October 30th has been worse than expected. Specifically , the Ivey PMI was 48.2 vs 53.0 forecast and they employment change for October was -1,800 vs +20,000 expected. US manufacturing data and employment data was roughly in-line to better than expected.
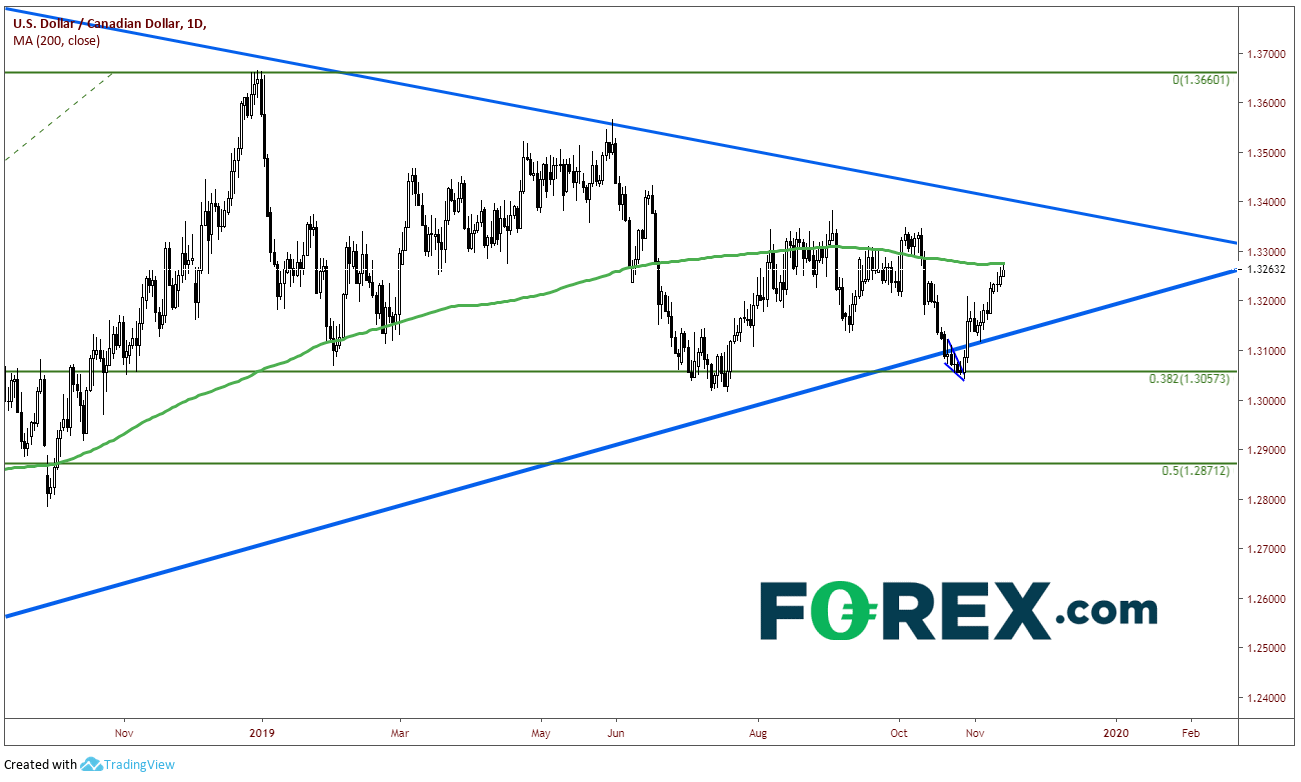
Technically, on a daily timeframe, USD/CAD put in a false breakdown below the rising trendline of the symmetrical triangle at the 38.2% Fibonacci retracement level from the September 2017 lows to the December 2018 highs. The pair formed a falling wedge into the low and broke out higher reaching the 100% retracement target of the falling wedge rather quickly. Price is currently testing the 200-day moving average at 1.3275.
Source: Tradingview, City Index
On a 240-minute time frame, we can see how USD/CAD broke out of the falling wedge and has retraced back to the 78.6% Fibonacci retracement level from the highs on October 10th to the lows on October 29th and is currently trading in an upward sloping channel. There is a large confluence of resistance which comes in slightly above currently levels (1.3260). In addition to the 200-day moving day moving average at 1.3275, that 78.6% retracement level is at 1.3280. There is horizontal resistance at 1.3290 and the top trendline of the channel also crosses near that same level. Support is now at the bottom trendline of the channel at 1.3247. Below that is horizontal support near 1.3210. There is then major support as the bottom trendline of symmetrical triangle (on daily and weekly timeframe), which crosses near 1.3140. In addition, the 200-week moving average crosses near that same level!
Source: Tradingview, City Index
What can cause USD/CAD to finally break out of the apex of the symmetrical triangle the pair has been in for so long? For starters, Bank of Canada Governor Stephen Poloz is speaking later this evening at the Federal Reserve Bank of San Francisco. Watch for changes in his “less hawkish” language from the October 30th statement. In addition, Canada is set to release CPI, ADP employment data, and Retail Sales next week. These figures will give a better indication of how well the Canadian economy is holding up.
From October 10th to October 29th, USD/CAD was pushing lower from 1.3362 down to 1.3030, threatening to breakdown from the symmetrical triangle the pair has been in since early 2016.
Source: Tradingview, FOREX.com
The market was pricing in a more hawkish BOC than the FOMC on October 30th, when both Committees coincidentally happened to be meeting on the same day. However, since the October 30th, USD/CAD has reversed and retraced 78.6% of the move from mid-October. So, what has changed?
First is that although the BOC left rates unchanged, they lowered their growth outlook. They were less hawkish then expected, and therefore, send USD/CAD bid off the lows. Second is that the Canadian data from since October 30th has been worse than expected. Specifically , the Ivey PMI was 48.2 vs 53.0 forecast and they employment change for October was -1,800 vs +20,000 expected. US manufacturing data and employment data was roughly in-line to better than expected.
Technically, on a daily timeframe, USD/CAD put in a false breakdown below the rising trendline of the symmetrical triangle at the 38.2% Fibonacci retracement level from the September 2017 lows to the December 2018 highs. The pair formed a falling wedge into the low and broke out higher reaching the 100% retracement target of the falling wedge rather quickly. Price is currently testing the 200-day moving average at 1.3275.
Source: Tradingview, FOREX.com
On a 240-minute time frame, we can see how USD/CAD broke out of the falling wedge and has retraced back to the 78.6% Fibonacci retracement level from the highs on October 10th to the lows on October 29th and is currently trading in an upward sloping channel. There is a large confluence of resistance which comes in slightly above currently levels (1.3260). In addition to the 200-day moving day moving average at 1.3275, that 78.6% retracement level is at 1.3280. There is horizontal resistance at 1.3290 and the top trendline of the channel also crosses near that same level. Support is now at the bottom trendline of the channel at 1.3247. Below that is horizontal support near 1.3210. There is then major support as the bottom trendline of symmetrical triangle (on daily and weekly timeframe), which crosses near 1.3140. In addition, the 200-week moving average crosses near that same level!
Source: Tradingview, FOREX.com
What can cause USD/CAD to finally break out of the apex of the symmetrical triangle the pair has been in for so long? For starters, Bank of Canada Governor Stephen Poloz is speaking later this evening at the Federal Reserve Bank of San Francisco. Watch for changes in his “less hawkish” language from the October 30th statement. In addition, Canada is set to release CPI, ADP employment data, and Retail Sales next week. These figures will give a better indication of how well the Canadian economy is holding up.
Related tags:


The complete CFD trading experience
Award-winning platforms, competitive spreads, low commissions and dedicated support.
We live and breathe the markets and are dedicated to helping traders realise their ambitions as we continue to set the industry bar.
Economic calendar
Web Trader platform
Our sophisticated web-based platform is packed with features.
Related articles

Japanese Yen Forecast: USD/JPY 4% Rally Challenges Post-Intervention Downtrend 9 24 2026
USD/JPY momentum has shifted sharply higher, putting a major resistance confluence in focus as U.S. and Japanese event risk builds.


Oil Quietly Hands the Fed a Reason to Stay Hawkish
Oil prices and the U.S. dollar are both on the front foot as elevated energy costs feed Fed warnings that inflation may prove sticky.


USD/JPY outlook: Hawkish Fed recalibration pressures the yen
Stronger US growth momentum and rising Treasury yields are keeping USD/JPY pointed higher, even as Japanese policymakers try to limit the pressure building across domestic markets.

StoneX Europe Ltd may make third party material available on this website which may contain information included but not limited to the conditions of financial markets. The material is for information purposes only and does not contain, and should not be construed as containing, investment advice and/or investment recommendation and/or an investment research and/or an offer of or solicitation for any transactions in financial instruments; any decision to enter into a specific transaction shall be made by the client following an assessment by him/her of their situation.
StoneX Europe Ltd makes no representation or warranty and assumes no liability as to the accuracy or completeness of the information provided, nor any loss arising from any investment based on a recommendation, forecast or other information supplied. You should always seek independent advice as to your suitability to speculate in any related markets and your ability to assume the associated risks, if you are at all unsure. We are not under any obligation to update any such material. Any opinion made may be personal to the author and may not reflect the opinion of StoneX Europe Ltd.