






USDCAD Unwind Could Just Be Getting Started
With a long-term trendline broken and bears clearly bac in control, the inflection point for the year has likely been seen.
Share this:

With a long-term trendline broken and bears clearly back in control, the inflection point for the year has likely been seen.
Just under two weeks ago, we outlined a case for USD/CAD to challenge long held views and perform a bearish reversal. At the time, it was resting precariously on its 2018 trendline, although the trendline has since broken and bearish momentum is clearly winning the battle.
Trade tensions have continued to thaw ahead of next week’s G20 meeting, rising inflation has dispelled calls for a rate cut and the USD has been under immense pressure following the dovish FOMC meeting this week. Along with rising oil prices, the environment has been favourable for a stronger Canadian dollar, although signs were already there ahead of these moves that bullish pressure could be building for the Canadian dollar.
- Several crosses were turning against CAD around the same time (CAD strength)
- Positioning on CAD has seen a steady decrease of short exposure this year
Since that tweet, both AUD/CAD and NZD/CAD have fallen 2.3%, and the latter has broken to a fresh YTD low. Therefore, we remain bearish on USD/CAD as part of a longer-term reversal.
We can see on the weekly chart that the 2019 high has provided a lower high, ahead of its trendline break. That we’ve also seen the two most bearish weeks this year underscores how the tide has likely turned, following its low volatility rise into the 2019 high.
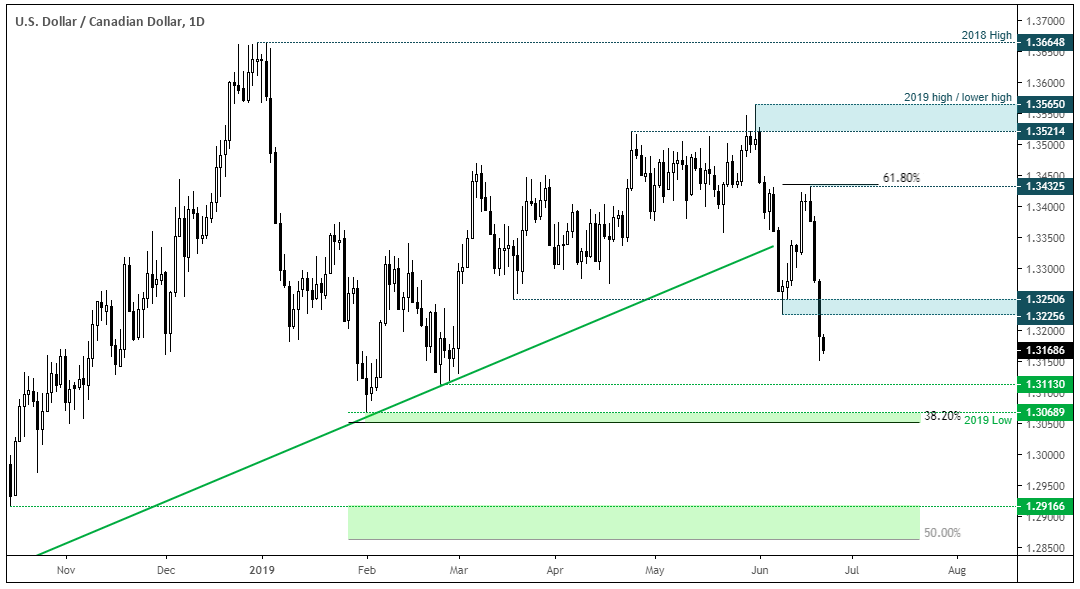
Switching to the daily chart shows a strong, bearish trend structure is developing.
- Bears could seek to fade into rallies up to the 1.3225/50 resistance zone (as the reward to risk potential on the daily chart is currently undesirable shorts) or seek bearish continuation patterns on lower timeframes.
- Next major support is around the 2019 lows where we’d expect a bout of profit taking (therefor a technical bounce), 1.3113 likely to provide interim support.
- A break above the resistance zone doesn’t invalidate the core bearish bias, we’d feel inclined to step aside until further signs of weakness appears whilst the bearish structure holds.
- As our core view of bearish, we expect the 2019 low to eventually give way. So, hopefully it will provide further opportunity to short for some sizeable moves on the daily charts.
With a long-term trendline broken and bears clearly back in control, the inflection point for the year has likely been seen.
Just under two weeks ago, we outlined a case for USD/CAD to challenge long held views and perform a bearish reversal. At the time, it was resting precariously on its 2018 trendline, although the trendline has since broken and bearish momentum is clearly winning the battle.
Trade tensions have continued to thaw ahead of next week’s G20 meeting, rising inflation has dispelled calls for a rate cut and the USD has been under immense pressure following the dovish FOMC meeting this week. Along with rising oil prices, the environment has been favourable for a stronger Canadian dollar, although signs were already there ahead of these moves that bullish pressure could be building for the Canadian dollar.
- Several crosses were turning against CAD around the same time (CAD strength)
- Positioning on CAD has seen a steady decrease of short exposure this year
Since that tweet, both AUD/CAD and NZD/CAD have fallen 2.3%, and the latter has broken to a fresh YTD low. Therefore, we remain bearish on USD/CAD as part of a longer-term reversal.
We can see on the weekly chart that the 2019 high has provided a lower high, ahead of its trendline break. That we’ve also seen the two most bearish weeks this year underscores how the tide has likely turned, following its low volatility rise into the 2019 high.
Switching to the daily chart shows a strong, bearish trend structure is developing.
- Bears could seek to fade into rallies up to the 1.3225/50 resistance zone (as the reward to risk potential on the daily chart is currently undesirable shorts) or seek bearish continuation patterns on lower timeframes.
- Next major support is around the 2019 lows where we’d expect a bout of profit taking (therefor a technical bounce), 1.3113 likely to provide interim support.
- A break above the resistance zone doesn’t invalidate the core bearish bias, we’d feel inclined to step aside until further signs of weakness appears whilst the bearish structure holds.
- As our core view of bearish, we expect the 2019 low to eventually give way. So, hopefully it will provide further opportunity to short for some sizeable moves on the daily charts.


The complete CFD trading experience
Award-winning platforms, competitive spreads, low commissions and dedicated support.
We live and breathe the markets and are dedicated to helping traders realise their ambitions as we continue to set the industry bar.
Economic calendar
Web Trader platform
Our sophisticated web-based platform is packed with features.
Related articles

US Core PCE Preview: Stale or Significant for the Fed
Core PCE inflation takes center stage Wednesday, with traders watching for signs of renewed price pressure and clues on whether the Fed could hike again in October.


Australian Dollar Forecast: AUD/USD Four-Week Slide Nears Critical Uptrend Support 9 29 2026
Aussie momentum has deteriorated sharply into quarter-end, with inflation, Core PCE and NFP on tap as AUD/USD closes in on a pivotal technical threshold.


Euro Forecast: EUR/USD Tumbles Towards Yearly Low as Daily RSI Goes Oversold
EUR/USD has been hit hard in the final month of the quarter as USD strength has shown up in a big way. With the pair set to challenge its yearly low as RSI has pushed into oversold territory, is there a chance for a pullback with some big headline risk hitting in the US over the next few days?

StoneX Europe Ltd may make third party material available on this website which may contain information included but not limited to the conditions of financial markets. The material is for information purposes only and does not contain, and should not be construed as containing, investment advice and/or investment recommendation and/or an investment research and/or an offer of or solicitation for any transactions in financial instruments; any decision to enter into a specific transaction shall be made by the client following an assessment by him/her of their situation.
StoneX Europe Ltd makes no representation or warranty and assumes no liability as to the accuracy or completeness of the information provided, nor any loss arising from any investment based on a recommendation, forecast or other information supplied. You should always seek independent advice as to your suitability to speculate in any related markets and your ability to assume the associated risks, if you are at all unsure. We are not under any obligation to update any such material. Any opinion made may be personal to the author and may not reflect the opinion of StoneX Europe Ltd.