




USD/JPY analysis: Asia’s slowing trade is a growing problem
Slower trade is a growing theme across Asia, with Japan’s export data showing signs of slower demand across Asia/ Meanwhile, USD/JPY has approached key resistance.
Share this:

Key takeaways
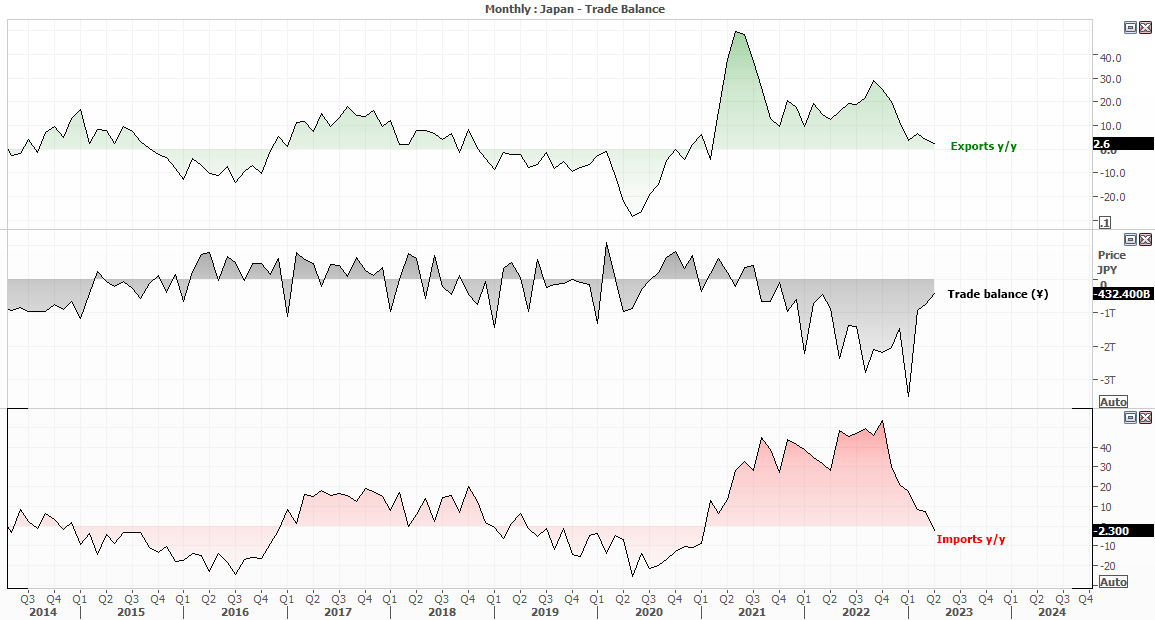
- Japan’s exports fell to a 2-year low of 2.6% y/y
- Imports (domestic demand for international goods) contracted -2.3%
- Exports to Asia contracted -6.3% y/y (-2.9% to China)
- Exports to the US, New Zealand and Australia rose 12%, 10.2% and 6.9% y/y respectively
- USD/JPY’s rally has stalled below the May high, where a pullback is favoured ahead of an eventual breakout
- The Nikkei is within striking distance of its 201 high
Slowing trade is a growing problem across Asia as we make our way through 2023, which in turn is a drag on global growth prospects. Already we have seen Q2 trade data for China take a hit, alongside contracting PMI’s, a slump in loan demand and softer figures for retail sales, industrial production and investment. And today we see that Japan’s exports fell to a 26-month low of 2.6% and imports contracted at their fastest pace since February 2021.
Looking behind the headline numbers reveals a slump in demand for Japan goods across Asia, with exports to the region falling -6.3% y/y. Interestingly, exports to China are also down -2.9% y/y and demand falters with China’s economic recovery. Although with China encouraging domestic-consumption to support growth, we’d expect this trend to continue and weaken Japan’s growth (with China being their largest trade partner).
Nikkei head for 2021 with debt-ceiling hopes
Debt-ceiling talks between US President Biden and Republican House Speaker McCarthy made a positive step, with both announcing that a deal is on the horizon. The fact that it is being announced is almost inevitable, as there really is no other choice. But if there is a pleasant surprise, it is that it didn’t happen at the absolute last minute.
The positive development prompted a risk-on rally on Wall Street, sending the Nasdaq to a 9-month high, WTI up 2.8% and gold down to a low of 1975. This in turn has provided a positive lead for Asian indices to help the ASX rebound back above 7200 and the Nikkei extend yesterday’s breakout above 30,000.
USD/JPY daily chart

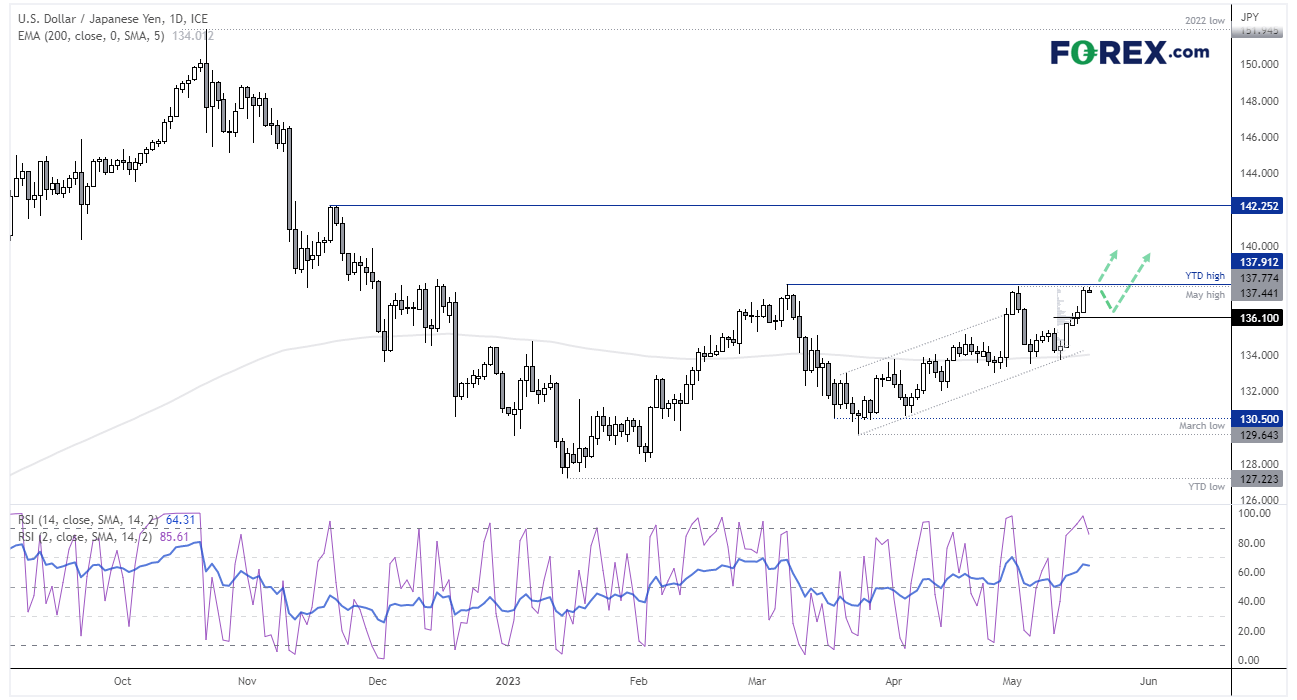
The pair has provided a strong rally since its based formed around the 200-day EMA last week, with a Doji. Yet the rally has stalled just beneath the YTD high – a level which prompted a selloff a couple of weeks ago – which leaves the potential for a pullback from current levels. RSI (2) is also oversold to warn of a near-term inflation point and a slight bearish divergence is forming in RSI (14).
Volume analysis of the rally shows heavy trading activity around 136.1, which could provide support should prices retrace before an anticipated breakout. But with a defiantly hawkish message from the Fed, a banking crisis that never and a dovish BOJ, an upside break if favoured sooner than later.
USD/JPY 1-hour chart


Whilst USD/JPY trades within a strong trend and bullish channel, there are early sigs of a potential top. A bearish engulfing candle and bearish pinbar formed on the 1-hour chart and the current candle is currently a bearish outside bar with high volume. Furthermore, none of the candles at the highs were able to test the May high.
A bearish divergence formed on RSI (2) leading into the highs and RSI (14) is now rolling over from the overbought zone. So we’re now seeking a countertrend move within the bullish channel whilst prices remain beneath 138.
-- Written by Matt Simpson
Follow Matt on Twitter @cLeverEdge
How to trade with City Index
You can trade with City Index by following these four easy steps:
- Open an account, or log in if you’re already a customer
• Open an account in the UK
• Open an account in Australia
• Open an account in Singapore
- Search for the market you want to trade in our award-winning platform
- Choose your position and size, and your stop and limit levels
- Place the trade
Related tags:
Latest market news




The complete CFD trading experience
Award-winning platforms, competitive spreads, low commissions and dedicated support.
We live and breathe the markets and are dedicated to helping traders realise their ambitions as we continue to set the industry bar.
Economic calendar
Web Trader platform
Our sophisticated web-based platform is packed with features.
Related articles
USD/JPY Q4 2026 Outlook: Hawkish Fed Pricing Clashes With Intervention Risk
The year-end tug-of-war is clear: hawkish Fed pricing supports USD/JPY, while intervention risk limits the upside.
Japanese Yen Forecast: USD/JPY 4% Rally Challenges Post-Intervention Downtrend 9 24 2026
USD/JPY momentum has shifted sharply higher, putting a major resistance confluence in focus as U.S. and Japanese event risk builds.


Oil Quietly Hands the Fed a Reason to Stay Hawkish
Oil prices and the U.S. dollar are both on the front foot as elevated energy costs feed Fed warnings that inflation may prove sticky.

StoneX Europe Ltd may make third party material available on this website which may contain information included but not limited to the conditions of financial markets. The material is for information purposes only and does not contain, and should not be construed as containing, investment advice and/or investment recommendation and/or an investment research and/or an offer of or solicitation for any transactions in financial instruments; any decision to enter into a specific transaction shall be made by the client following an assessment by him/her of their situation.
StoneX Europe Ltd makes no representation or warranty and assumes no liability as to the accuracy or completeness of the information provided, nor any loss arising from any investment based on a recommendation, forecast or other information supplied. You should always seek independent advice as to your suitability to speculate in any related markets and your ability to assume the associated risks, if you are at all unsure. We are not under any obligation to update any such material. Any opinion made may be personal to the author and may not reflect the opinion of StoneX Europe Ltd.