




USDJPY break out spells trouble for gold
It has hit a new high for 2020 despite Friday’s disappointing US jobs report, with the yen also weakening...
Share this:

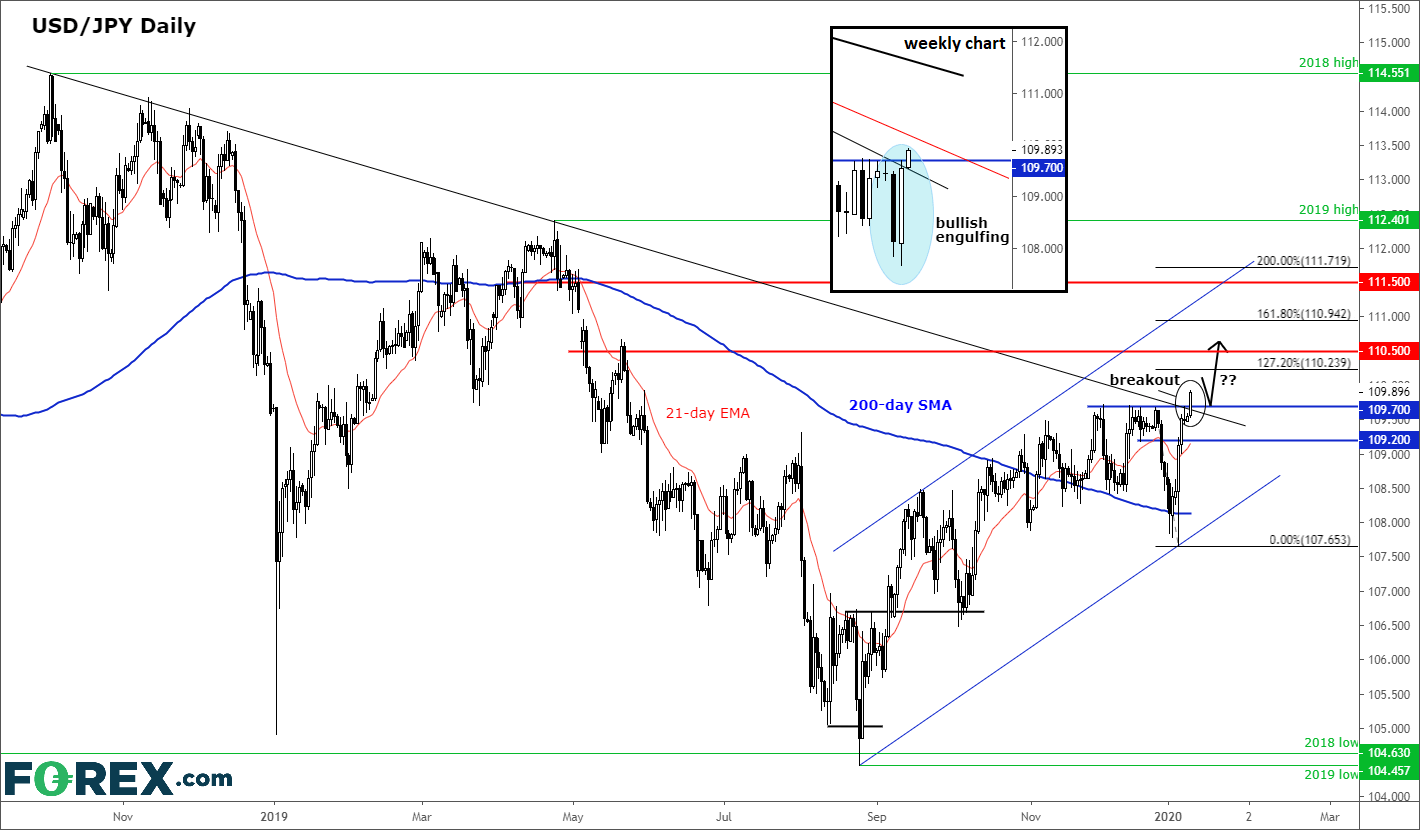
The USD/JPY looks very interesting as the new week begins. It has hit a new high for 2020 despite Friday’s disappointing US jobs report, with the yen also weakening amid ongoing risk-on sentiment as investors anticipate the signing of the much-touted phase one trade deal between the US and China on Wednesday.
If the price action on this pair is anything to go by then gold could head in the opposite direction as demand for safe-haven assets drop back with the US-Iran tensions easing. Indeed, gold and the USD/JPY tend to have a strong negative correlation with one another. Gold bugs better hope then that either the negative correlation breaks down or the breakout in the USD/JPY turns out to be a fake one.
Source: Trading View and City Index.
But for now, price action on the USD/JPY appears rather bullish. On the weekly (inset), it formed a large bullish engulfing candle last week, with the reversal price action causing rates to peak above a bearish trend line and key short-term resistance at 109.70. Price now needs to hold above this level if the bulls want to take full control of near-term price action. However, a daily close back below 109.70, if seen, would complicate the outlook.
The USD/JPY looks very interesting as the new week begins. It has hit a new high for 2020 despite Friday’s disappointing US jobs report, with the yen also weakening amid ongoing risk-on sentiment as investors anticipate the signing of the much-touted phase one trade deal between the US and China on Wednesday.
If the price action on this pair is anything to go by then gold could head in the opposite direction as demand for safe-haven assets drop back with the US-Iran tensions easing. Indeed, gold and the USD/JPY tend to have a strong negative correlation with one another. Gold bugs better hope then that either the negative correlation breaks down or the breakout in the USD/JPY turns out to be a fake one.
Source: Trading View and FOREX.com.
But for now, price action on the USD/JPY appears rather bullish. On the weekly (inset), it formed a large bullish engulfing candle last week, with the reversal price action causing rates to peak above a bearish trend line and key short-term resistance at 109.70. Price now needs to hold above this level if the bulls want to take full control of near-term price action. However, a daily close back below 109.70, if seen, would complicate the outlook.



The complete CFD trading experience
Award-winning platforms, competitive spreads, low commissions and dedicated support.
We live and breathe the markets and are dedicated to helping traders realise their ambitions as we continue to set the industry bar.
Economic calendar
Web Trader platform
Our sophisticated web-based platform is packed with features.
Related articles
Oil, Gold Forecast: Two trades to watch 280926
Oil Rises as U.S.-Iran Peace Hopes Fade. Gold Breaks Down on Hawkish Fed Expectations as Treasury Yields and USD Rise.

Gold Outlook: XAU/USD hit hard as US yields, dollar resume ascent
A stronger dollar, surging front-end yields and renewed geopolitical tension have combined to push gold back towards key technical support.


EUR/USD weekly outlook: Oil, inflation and NFP in focus
After coming under significant pressure in recent weeks, the EUR/USD came off its lows to finish the week on a positive note on Friday, albeit with only a mild rebound. That was not enough to prevent the exchange rate falling for the third consecutive week, as the US dollar and bond yields rallied across the board.

StoneX Europe Ltd may make third party material available on this website which may contain information included but not limited to the conditions of financial markets. The material is for information purposes only and does not contain, and should not be construed as containing, investment advice and/or investment recommendation and/or an investment research and/or an offer of or solicitation for any transactions in financial instruments; any decision to enter into a specific transaction shall be made by the client following an assessment by him/her of their situation.
StoneX Europe Ltd makes no representation or warranty and assumes no liability as to the accuracy or completeness of the information provided, nor any loss arising from any investment based on a recommendation, forecast or other information supplied. You should always seek independent advice as to your suitability to speculate in any related markets and your ability to assume the associated risks, if you are at all unsure. We are not under any obligation to update any such material. Any opinion made may be personal to the author and may not reflect the opinion of StoneX Europe Ltd.